data

In my travels around the internet, I recently came across three interesting infographics related to race/ethnicity and immigration.

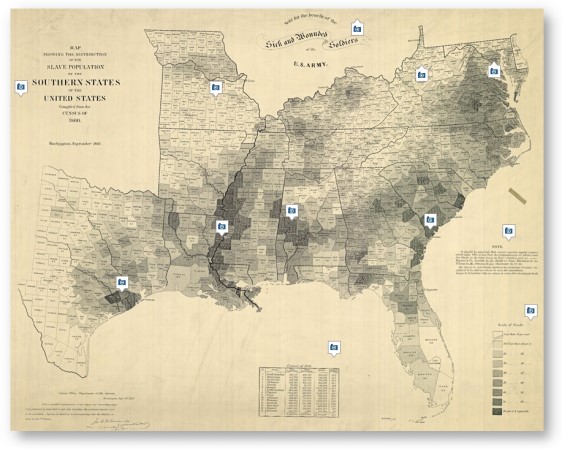
The first one is a “Map of American Slavery,” published in the New York Times (small thumbnail below, you can click on it to go to the larger version at the NY Times site). For casual historians like me, it is interesting to see that the counties that had the highest concentration of slaves were generally located along the Mississippi River and whose labor was in demand the most to facilitate trade, further reinforcing the notion that so much of the American south’s economy was fundamentally tied to slavery.

Map of American Slavery © Geography and Map Division, Library of Congress

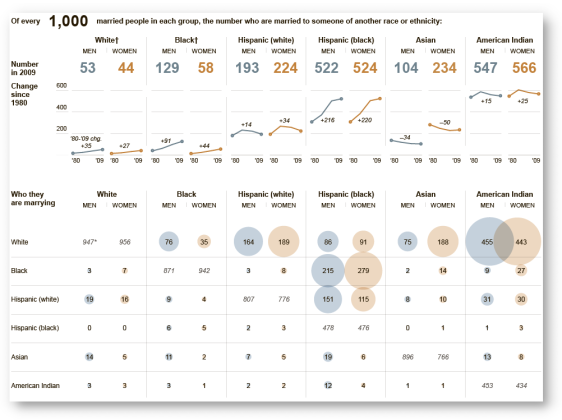
The second interesting infographic is entitled “Who is Marrying Whom,” also was published by the New York Times, and shows a visual breakdown of interracial marriage across the major racial/ethnic groups in the U.S. (again, you can click on the thumbnail below to see the full-size version). In looking it over, some of the most interesting results are:

Who is Marrying Whom © New York Times
  • The groups that seem to have the highest rates of being interracially married are American Indians and Black Hispanics.
  • The largest gender disparities are among Blacks and Asian Americans, although the gender pattern is the opposite for each: Black men are 124% more likely to be interracially married than Black women, while Asian American women are 125% more likely to be married interracially than Asian American men.
  • Since around 1990 or so, interracial marriage rates have actually been declining for White Hispanics and American Indians. Moreover, for Asian Americans, they’ve been generally declining since 1980. For White Hispanics and Asian Americans, I believe much of this decline is due to the large influx of immigrants since the ’80s and ’90s, many of whom are already married as they arrive in the U.S. or are less likely to intermarry in general. As such, it would be interesting to see these same numbers for just U.S.-raised members of these racial groups (those who were born in the U.S. or arrived at at 13 or younger and therefore, and therefore were socialized within the U.S. racial landscape).

The interracial marriage graphic is linked to an interesting article also on the NY Times site that discusses the growing multiracial/mixed-race population in the U.S. and how they are increasingly forging their own identity that combines elements of both sides of their ancestry, rather than trying to fit themselves into preexisting and frequently narrowly-defined racial/ethnic categories, as this video clip shows:

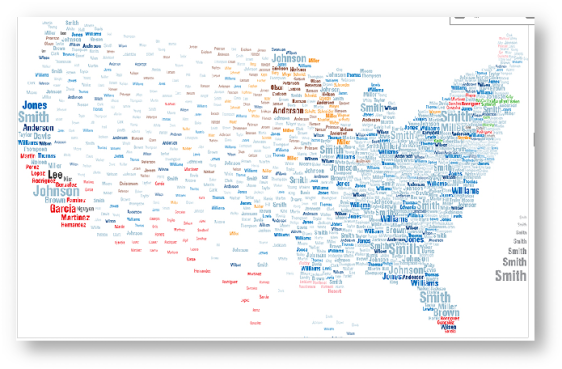
A third interesting infographic was published by the National Geographic Society, titled “What’s in a Surname?” and shows some of the most common surnames in different geographic parts of the U.S. The map confirms what demographers have noted for some time now — racial/ethnic minorities (represented here by their surnames) are increasingly becoming the majority population in many parts of the U.S. (again, click on the thumbnail below to view the larger interactive graphic at the National Geographic Society site).

Map of American Surnames © National Geographic Society

As one example, in the southern California part of the map, some of the most common surnames are Garcia, Martinez, Hernandez and even Nguyen (a nod to the huge Vietnamese American “Little Saigon” community in Orange County). There are further large concentrations of Latino surnames (represented in red) in the southwestern U.S., southern Florida, and upstate New York as well. And unbeknown to me, there is apparently a large contingent of Koreans named “Kim” in central California.

Each year, the Federal Bureau of Investigation releases its official report on Hate Crimes in the U.S. First, a little background — hate crimes are defined as a criminal offense committed against a person or property, which is motivated, in whole or in part, by bias against the victim’s actual or perceived race, ethnicity, religion, sexual orientation, or disability, and that is formally reported to law enforcement. This definition is important in many ways, as I explain a little later.

Regarding the just-released data for 2008, in comparison to the data from 2007, there are good news and there are bad news. First, some of the good news:

  • The number of hate crimes committed against Asian Americans and Pacific Islander Americans declined from 188 incidents and 219 offenses in 2007, to 137 incidents and 162 offenses in 2008.
  • Similarly, the number of hate crimes committed against Hispanic Americans declined from 595 incidents and 775 offenses in 2007, to 561 incidents and 735 offenses in 2008.
  • The number of hate crimes committed against Muslim Americans also declined, from 115 incidents and 133 offenses in 2007, to 105 incidents and 123 offenses in 2008.

These are positive signs of progress and we should acknowledge them as such. Unfortunately there appears to be at least an equal number of bad news as well:

  • In total, the number of reported hate crimes are at their highest level since 2001. In 2008, there were 7,783 hate crime incidents and 9,168 hate crime offenses reported, an increase from 7,624 and 9,006 reported in 2007, respectively.
  • The number of hate crime crimes directed at Blacks increased from 2,658 incidents and 3,275 offenses in 2007, to 2,876 incidents and 3,413 offenses in 2008. Such anti-Black hate crimes are at their highest levels since 2001 and are pretty clear evidence that despite Barack Obama’s election, racism against Blacks is still alive and well in America.
  • Hate crimes based on sexual orientation are also at their highest level since 2001, increasing from 1,265 incidents and 1,460 offenses in 2007, to 1,297 and 1,617 in 2008, respectively.
  • Aside from the decline in anti-Muslim hate crimes, there was an overall increase in the number of hate crimes based on religious bias in general. For example, the number of hate incidents and offenses committed against Jewish Americans increased from 969 and 1,010 in 2007, to 1,013 and 1,055 in 2008, respectively.

To further put these hate crime numbers in perspective, we should note the specifics related to how they were collected. Specifically, as in years past, the vast majority of the law enforcement agencies who participated in the data collection (84.4% to be exact) reported absolutely zero hate crimes — that there were no hate crime incidents in their particular jurisdiction.

In addition, thousands of police agencies across the nation did not participate in the hate crime data collection program at all, including at least five agencies in cities with a popular of over 250,000 and at least eleven agencies in cities with populations between 100,000 and 250,000.

Many of these jurisdictions who did not participate or who reported zero hate crimes include areas in the South. I’m sorry, but I have a hard time accepting that there was only one (1) hate crime committed in the state of Mississippi, just two (2) in Georgia, and just four (4) in Alabama in 2008.

On top of this uneven and inconsistent participation and reporting on the part of police agencies, we should also note that, as sociological and criminological studies consistently point out, the majority of hate crime incidents are never reported to police at all — their victims stay silent. This is particularly true with many immigrant groups and communities of color, including Asian Americans.

That is, many victims may not be fluent in English and therefore feel that it is futile to report it to the police. They may also feel that the police would be unlikely to take their reports seriously for lack of cultural competency, or they may distrust the police entirely based on previous negative experiences with police in their area, or with corrupt police and government agencies back in their home country. Also, many victims may simply fear retaliation from the offenders if they report the incidents to police.

As you can see, the “official” data should be taken with a big grain of salt and almost surely represent an undercount — maybe even a significant one — of the real number of hate crimes committed in 2008. Unfortunately, in the quest for racial/ethnic/religious/sexual equality, American society still seems to be taking two steps forward, and two steps back.

If you’ve read more than a few articles on Asian-Nation, you already know that I rely a lot on Census data and statistics for this website and blog. In addition, as an academic, I also use Census data heavily for my own research studies, as do thousands of other sociologists, demographers, statisticians, analysts, and others in all kinds of disciplines and fields.

It’s with this in mind that many of us are eagerly anticipating the 2010 Census. After the questionnaires and data collection start this spring, the actual data won’t be completely tabulated and released to the public until 2013 or so. Nonetheless, as a recent Time magazine article describes, diverse racial and ethnic groups around the country understand how important it is that the federal government has an accurate count of their population numbers and the overall importance of these Census data to American society in general:

The U.S. Census is gearing up for its once-a-decade tally of America’s population. And so are thousands of groups with a vested interest in being fully counted — since the Census determines not just seats in the House of Representatives but also how some $400 billion in annual federal funding gets divvied up, the way companies think about where to build factories and stores, and the shape of political and social discourse about issues like race, ethnicity and urban vs. rural America. . . .

Brazilians in Boston are creating public-service announcements to run on Portuguese-language radio stations. The state of California is handing out maps of neighborhoods with low participation rates in the last Census so community groups can target where to knock on doors. . . . “The Census,” says Melanie Campbell of the National Coalition on Black Civic Participation, “is all about financial resources and power.” . . .

To think about what’s at stake — beyond $3 billion in unemployment funds, $4 billion worth of rural-electrification loans, $6 billion in Head Start money and hundreds of billions of other federal dollars — consider the Burmese. Some 17,000 people living in the U.S. identified themselves as Burmese in the 2000 Census, but “we know that’s not the right number,” says Aung Naing, chairman of the Burmese Complete Count Committee. . .

In Southern California alone, there are seven or eight Burmese Buddhist temples, he says. So since the fall, Naing has been traveling the country, explaining to Burmese groups that the Census counts everybody — citizen or not — and that the data collected aren’t shared with other parts of the government, like immigration or taxing authorities (common fears that drive down response rates among many minority groups, including blacks and Hispanics).

The Time article acknowledges that there have been instances in the past where Census data has been used against particular racial/ethnic groups, such as during World War II when they were used to identify neighborhoods that had large Japanese American populations, so that they could more easily be rounded up and placed in prison camps.

There are also many Americans who don’t trust the federal government in general and will refuse to complete a Census form based solely on those grounds. As I’ve also written about, the Census Bureau has also experienced more than a few bureaucratic glitches that it will hopefully resolve under the guidance of its new boss, Secretary of Commerce Gary Locke.

For people and community organizations interested in learning more about the Census’s importance to Americans of all backgrounds, or in helping to promote participation in their own community, there are some excellent resources at CivilRights.org and NonProfitsCount.org. The Census Bureau also has numerous informational material translated in dozens of languages for downloading. As with the Time magazine article, these resources emphasize that an accurate count of the U.S.’s population forms the basis for many important but often overlooked political, economic, and social decisions that are made that end up affecting our daily lives.

As it relates to Asian Americans, the Asian American Justice Center has a nice summary of the Census’s importance to APAs. Also, the Census Bureau has produced some short videos introducing and promoting the 2010 Census, with the embedded clip below aimed specifically at Asian Americans (the clips are a little elementary but are a good way to start the discussion):

Also, my good friend and colleague Larry Shinagawa is Director of the Asian Pacific American Census Information Center (APACIC), based out of the Asian American Studies Program at the University of Maryland. As noted on their website:

[The APACIC] was established to serve the census data needs of the national, regional, and local Washington metropolitan area Asian Pacific American communities. In September 2006, APACIC was designated as a Census Information Center (CIC) by the U.S. Census Bureau. As a member of the U.S. CIC Program, APACIC serves underserved and disadvantaged Asian Pacific American communities especially in the mid-Atlantic region by providing access to U.S. Census Bureau products.

The APACIC page linked to above also contains numerous resources and reports on various Asian American ethnic groups and other aspects of the Asian American population for those who are interested. I hope all Americans, and particularly Asian Americans, will complete and return the Census questionnaire that they’ll receive soon so that we have as accurate as possible a picture of our society and population.

February is Black/African American History Month and the Census Bureau has again provided us with an historical summary and a few noteworthy statistics for this occasion:

To commemorate and celebrate the contributions to our nation made by people of African descent, American historian Carter G. Woodson established Black History Week. The first celebration occurred on Feb. 12, 1926. For many years, the second week of February was set aside for this celebration to coincide with the birthdays of abolitionist/editor Frederick Douglass and Abraham Lincoln. In 1976, as part of the nation’s bicentennial, the week was expanded into Black History Month. Each year, U. S. presidents proclaim February as National African-American History Month.

40.7 million
As of July 1, 2007, the estimated population of black residents in the United States, including those of more than one race. They made up 13.5 percent of the total U.S. population.

65.7 million
The projected black population of the United States (including those of more than one race) for July 1, 2050. On that date, according to the projection, blacks would constitute 15 percent of the nation’s total population.

38%
Percentage of Mississippi’s population that is black, highest of any state. Blacks also make up more than a quarter of the population in Louisiana (32%), Georgia (31%), Maryland (30%), South Carolina (29%) and Alabama (27%). They comprise 56% of the population in the District of Columbia.

2.4 million
Number of single-race black military veterans in the United States in 2007. More military veterans are black than any other minority group.

19%
Percentage of single-race blacks 25 and older who had a bachelor’s degree or higher in 2007.

1.2 million
Among single-race blacks 25 and older, the number who had an advanced degree in 2007 (e.g., master’s, doctorate, medical or law). In 1997, 717,000 blacks had this level of education.

$88.6 billion
Revenues for black-owned businesses in 2002. The number of black-owned businesses totaled nearly 1.2 million in 2002. Black-owned firms accounted for 5 percent of all non-farm businesses in the United States.

$33,916
The annual median income of single-race black households in 2007, up from $32,876 (in 2007 constant dollars) in 2006.

24.5%
Poverty rate in 2007 for single-race blacks, statistically unchanged from 2006.

64.5%
Percentage of families among households with a single-race black householder. There were 8.5 million black family households.

46%
Nationally, the percentage of households with a householder who is single-race black who lived in owner-occupied homes. The rate was higher in certain states, such as Mississippi, where it reached 59%.

27%
The percentage of single-race blacks 16 and older who work in management, professional and related occupations. There are 49,730 black physicians and surgeons, 70,620 postsecondary teachers, 49,050 lawyers, and 57,720 chief executives.

With all of the recent buzz and excitement surrounding the Presidential election and Obama’s victory, I haven’t had the chance to post this until now:

November is American Indian and Alaska Native Heritage Month and the Census Bureau has again provided us with an historical summary and a few noteworthy statistics for this occasion:

The first American Indian Day was celebrated in May 1916 in New York. Red Fox James, a Blackfeet Indian, rode horseback from state to state, getting endorsements from 24 state governments, to have a day to honor American Indians. In 1990, President George H.W. Bush signed a joint congressional resolution designating November 1990 as “National American Indian Heritage Month.”

4.5 million
As of July 1, 2007, the estimated population of American Indians and Alaska Natives, including those of more than one race. They made up 1.5% of the total population.

30.3
Median age of the single-race American Indian and Alaska Native population in 2007, younger than the median of 36.6 for the population as a whole. About 27% of American Indians and Alaska Natives were younger than 18, and 8% were 65 and older.

5
Number of states where American Indians and Alaska Natives were the largest race or ethnic minority group in 2007. These states are Alaska, Montana, North Dakota, Oklahoma and South Dakota.

18%
The proportion of Alaska’s population identified as American Indian and Alaska Native as of July 1, 2007, the highest rate for this race group of any state. Alaska was followed by Oklahoma (11%) and New Mexico (10%).

76%
The percentage of American Indians and Alaska Natives 25 and older who had at least a high school diploma. Also, 13% had at least a bachelor’s degree.

25%
The percentage of civilian-employed American Indian and Alaska Native people 16 and older who worked in management, professional and related occupations. In addition, 23 percent worked in sales and office occupations and about the same percentage worked in service occupations.

$35,343
The 2007 median income of households where the householder reported being American Indian and Alaska Native and no other race.

25.3%
The 2007 poverty rate of people who reported they were American Indian and Alaska Native and no other race.

September 15 through October 15 is Hispanic Heritage Month. Below is an historical summary and a few noteworthy statistics published by the Census Bureau for this occasion:

In September 1968, Congress authorized President Lyndon B. Johnson to proclaim National Hispanic Heritage Week, which was observed during the week that included Sept. 15 and Sept. 16. The observance was expanded in 1988 to a month-long celebration (Sept. 15 – Oct. 15).

America celebrates the culture and traditions of those who trace their roots to Spain, Mexico and the Spanish-speaking nations of Central America, South America and the Caribbean.

Sept. 15 was chosen as the starting point for the celebration because it is the anniversary of independence of five Latin American countries: Costa Rica, El Salvador, Guatemala, Honduras and Nicaragua. In addition, Mexico and Chile celebrate their independence days on Sept. 16 and Sept. 18, respectively.

45.5 million
The estimated Hispanic population of the United States as of July 1, 2007, making people of Hispanic origin the nation’s largest ethnic or race minority, constituting 15 percent of the nation’s total population. In addition, there are approximately 3.9 million residents of Puerto Rico.

22.4 million
The nation’s Hispanic population during the 1990 Census — less than half the current total.

102.6 million
The projected Hispanic population of the United States on July 1, 2050. According to this projection, Hispanics will constitute 24 percent of the nation’s population by that date.

64%
The percentage of Hispanic-origin people in the United States who are of Mexican background. Another 9% are of Puerto Rican background, with 3.4% Cuban, 3.1% Salvadoran and 2.8% Dominican. The remainder are of some other Central American, South American or other Hispanic or Latino origin.

27.6 years
Median age of the Hispanic population in 2007. This compares with 36.6 years for the population as a whole.

48%
The percentage of the Hispanic-origin population that lives in California or Texas. California is home to 13.2 million Hispanics, and Texas is home to 8.6 million.

16
The number of states with at least a half-million Hispanic residents. They are Arizona, California, Colorado, Florida, Georgia, Illinois, Massachusetts, Nevada, New Jersey, New Mexico, New York, North Carolina, Pennsylvania, Texas, Virginia and Washington.

1.6 million
The number of Hispanic-owned businesses in 2002.

$222 billion
Revenue generated by Hispanic-owned businesses in 2002, up 19 percent from 1997.

$37,781
The median income of Hispanic households in 2006, statistically unchanged from the previous year after adjusting for inflation.

20.6%
The poverty rate among Hispanics in 2006, down from 21.8 percent in 2005.

60%
The percentage of Hispanics 25 and older who had at least a high school education in 2007.

13%
The percentage of the Hispanic population 25 and older with a bachelor’s degree or higher in 2007.

11%
Percentage of all college students in October 2006 who were Hispanic. Among elementary and high school students combined, the corresponding proportion was 19 percent.

17%
The percentage of Hispanics 16 or older who work in management, professional and related occupations. Roughly the same percentage work in construction, extraction, maintenance and repair occupations. Approximately 24% of Hispanics 16 or older work in service occupations; 22% in sales and office occupations; and 18% in production, transportation and material moving occupations.

7.6 million
The number of Hispanic citizens who reported voting in the 2004 presidential election. The percentage of Hispanic citizens voting — about 47% — did not change statistically from four years earlier.

1.1 million
The number of Hispanic veterans of the U.S. armed forces.

Below is an announcement from a reader asking for my help in publicizing research she is doing on Asian Americans and social anxiety. For your participation, you’ll be entered into a lottery to win a $60 gift card.

But even if you don’t win, as I’ve said before, surveys like this are great ways for us as Asian Americans to do our part to address the history of our community being systematically excluded from research like this. Take a few minutes of your time and help end the silence and help make our voices heard:

I am conducting research for my dissertation examining how culture and ethnicity may affect social anxiety, in particular with different Asian-American groups.

I am seeking Asian-American adults (18 years and older) to fill out a short series of questionnaires online (please go to www.ResearchStudy1.blogspot.com to be directed to the survey) . Asian-Americans without social anxiety, or those who are not sure, are also needed for this study for comparison purposes.

There has been little research done on how various factors affect Asian-American mental health. This study hopes to contribute to the field of understanding Asian-Americans, and lead to effective treatments in Asian-American mental health.

It should take less than 35 minutes and participants will be entered into a lottery for a $60 gift certificate from one of these store of your choice (Target, Amazon.com, Sephora, Best Buy).

All adults (18 years and older) are very welcome to participate! Please pass this on to anyone that would be interested. Strict confidentiality is maintained. If you have any questions or would like further information, please contact the principal investigator of this study at SocialAnxietyandEthnicity@gmail.com .

Direct link to the survey: http://www.surveymonkey.com/s.aspx?sm=2_2fS9j_2fPdPQmwAeLRwMYetA_3d_3d