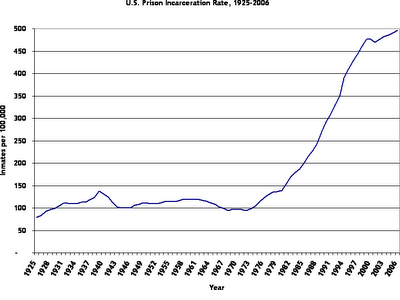
i’m more concerned with rates than numbers, so my figure above standardizes by population to show the long-term trend in prison incarceration. the 2006 rate was 497 per 100,000 u.s. residents, or 750 per 100,000 counting jail inmates.
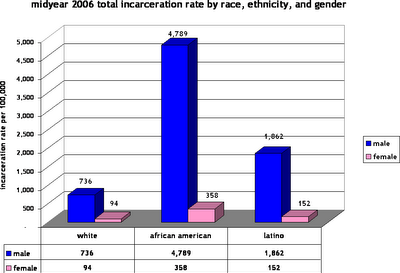
most people know that incarceration rates are highest for african american males, but it is sometimes tough to get one’s head around the magnitude of group differences in punishment. in 2006, about 4.8 percent of all african american men and about 11.7 percent of african american men in their twenties were incarcerated. as the figure below shows, the incarceration rate for african american men is currently fifty times higher than the incarceration rate for white women (4,789/94 = 50.9).
the disparities are much greater, of course, when age is thrown into the mix. the rate for african american men in their twenties is about 1,300 times higher than the incarceration rate for white women aged 55 and over. white guys my age have a rate of 1,419 per 100,000, which is significantly higher than any of the female rates (which top out at 999 for african american women in their late thirties), but significantly lower than the rates for latino or african american men in all but the oldest age group.
finally, there is great state-to-state variation, with louisiana (835 per 100,000 residents), texas (687), and oklahoma (658) leading the nation in punishment. the lowest incarceration rates were in maine (141 per 100,000 residents), minnesota (189) and rhode island (195).


Comments