graphic by L. Norén

race-and-ethnicity-in-america

What works

This graphic does a great job of depicting race and ethnicity as distinct concepts. The orange hash marks above the racial groupings indicate the proportion of people in the racial categories that are also Hispanic by ethnicity. I made this to correct the graphics that lump race and ethnicity together (and – bafflingly – they still add up to 100%).

Race and ethnicity are not the same. Race refers to differences between people that include physical differences like skin color, hair texture and the shape of eyelids though the physical characteristics that add up to a social decision to consider person A a member of racial group 1 can change over time. Irish and Italian people in America used to be considered separate racial groups, based in part on skin color distinctions that most Americans could no longer make. What does “swarthy” look like anyway?

Ethnicity – a closely related concept – refers to shared cultural traits like language, religion, beliefs, and foodways. Often, people who are in a racial group also share an ethnicity, but this certainly isn’t always true. American Indians are considered a racial group but there are hundreds and hundreds of distinct tribes in the US and their religions, beliefs, foodways, and languages vary from tribe to tribe. Hispanics in America often share common language(s) (Spanish and/or English) but they may not share the same race. At the moment, most Hispanics in America self-identify as white. I have often wondered if, when I’m 60, the ethnic boundaries currently describing Hispanic people will have faded away, much like the boundaries describing Italian and Irish folks faded away, becoming more of a symbolic ethnicity that can become more important during the holidays and less important during day-to-day life.

What needs work

The elephant on the blog is that I have been on hiatus since February. I’m writing my dissertation and I plan to stay on hiatus through the spring to finish that. My decision may seem irresponsible from the perspective of regular readers and I apologize for my absence.
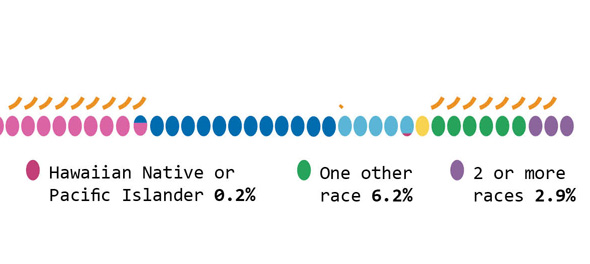
Close-up of graphic
Close-up of graphic


As for the graphic, it was designed to run along the bottom of a two-page spread so it does not work well here on the blog. If anyone wants a higher-resolution version to use in class or in a powerpoint, shoot me an email and I’ll send it.

References

US Census, 2012 using 2010 data.

Office email traffic

Editing process in graphic design

The editing process in graphic design is somewhat different than the editing process in writing. Writers tend to start with a skeleton, make sure the bones are all in the right places, and then slowly add and sculpt musculature and skin through iterative processes. Graphic designers start with a whole bunch of skeletons, subtract a few, add musculature to the rest, subtract a few of those, add skin to the remaining ones, and then only late in the process will a single design go through a final polishing process.

One of the ways social scientists teach students to become skeptical about the things they read is by teaching them how to edit their own work and the work of others. Students start to see how pieces of written work represent a series of choices. They see that what they’ve read could have gone in other conceptual directions, used different evidence, been shortened, lengthened, stripped of jargon, or otherwise constructed and styled in new ways that could have changed the meanings taken away by the readers. Learning to construct, critique, and polish writing is a major part of how readers develop the tools they need to understand and analyze the works they read.

There is far less educational time spent teaching students how to create visual work, especially visual work outside of the realm of personal expression (I feel like most arts programs emphasize personal expression which is different than creating visual work with the intent of displaying data or even political messaging). It is not surprising that we end up with a bunch of people who struggle to apply an analytic lens to information graphics. This leads to a communications power imbalance that privileges certain kinds of visual devices, including information graphics, over writing inasmuch as information graphics are more likely to be accepted without too much scrutiny since most folks do not have a good idea where to begin to scrutinize them. Information graphics combine the moral authority of numbers with the cognitive inertia of sight that lies behind the cliche that ‘seeing is believing’.

In the service of pulling back the curtain on graphic design, I thought it might be useful to save an entire series of drafts in the development process of a graphic that describes the email traffic in a small design work group. The purpose is to break the seal around the image and reveal it is a series of decisions that might easily have been otherwise.

First Draft

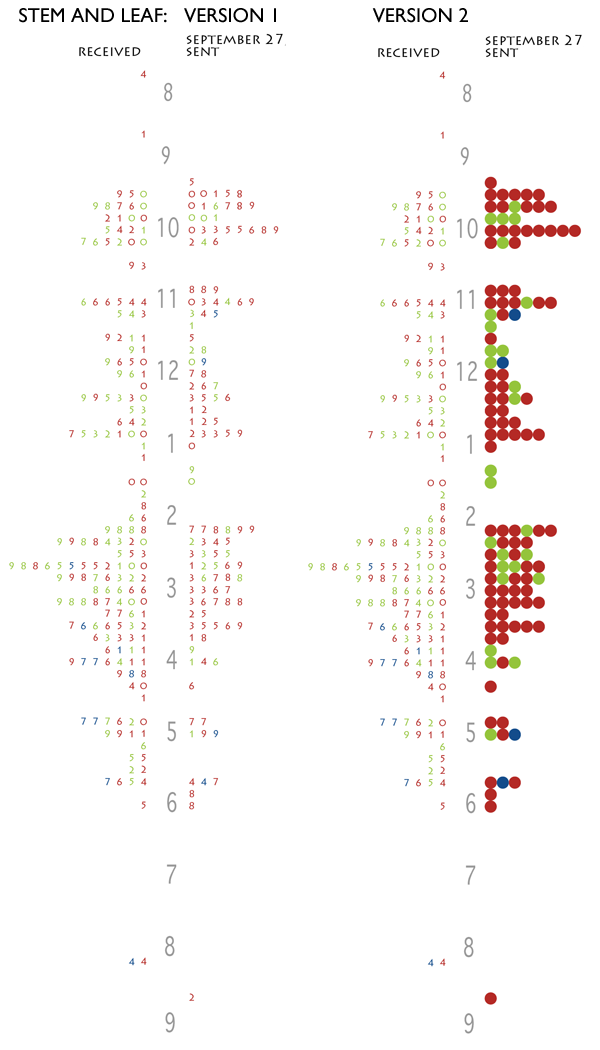
First, I thought a stem and leaf diagram might work.

Stem and Leaf diagrams of office email traffic

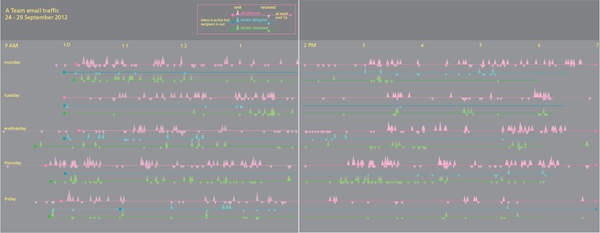
But these graphics failed because there was no way to keep strings of receiving or sending visually united. If the people in the office happened to be sending (or receiving) a series of email that spanned between one ten-minute period and the next ten-minute period, that run would be visually broken. I also wasn’t thrilled with the way the sent email matched up with the received email. It was hard to see that when one person in the office sent an email, it would often land in the inbox of someone else in the office.

Still, I liked the version where I turned the numbers into balls and that idea came back in a different form later in the development process.

Second Draft

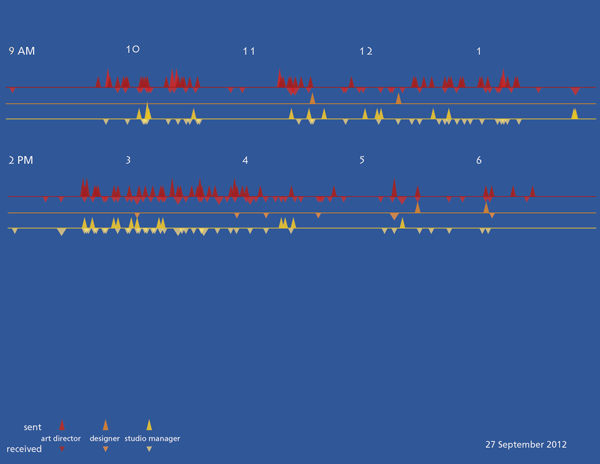
I decided to abandon the stem and leaf for a timeline. I initially imagined triangles as markers for the email because I thought the shape would indicate the directionality of an email going out into the internet.

email traffic timeline, version 1
This version has an entire day on one page, morning sits above afternoon.

And I tried some different color schemes.

Email traffic timeline, version 1.1
Email traffic timeline, version 1.1 stretching the day across two pages.
Email traffic timeline, version 1.2

The triangles did not work and some of the color schemes created a sense of vibration. A trained graphic designer might have tried the triangles (and rejected them, of course), but they would not have made the mistakes with color that I did.

Third draft

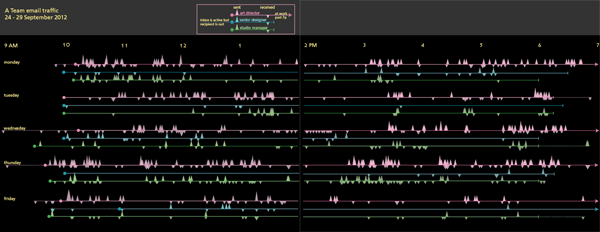
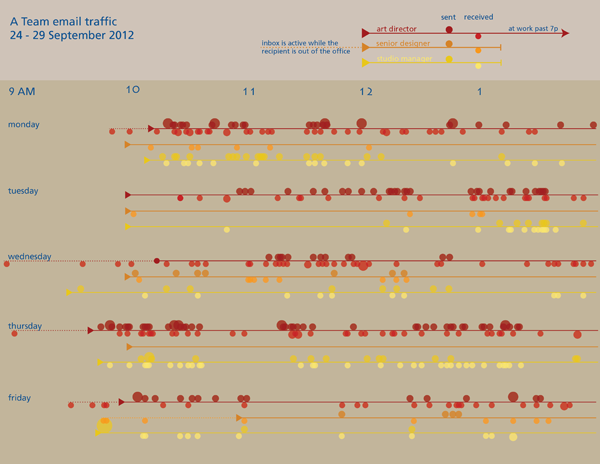
I replotted the graphic with circles, not triangles, and added up all the emails that were received in 5-minute periods instead of plotting each individually. This lost a bit of granularity, but it made it easier to see where traffic was greatest because it allowed the height of the circles start to draw the eye.

Email timeline, version 1.3
There is another page to the right of this one but viewing the image at this scale displays more detail.

This version is much closer to the final but something was missing.

Fourth draft

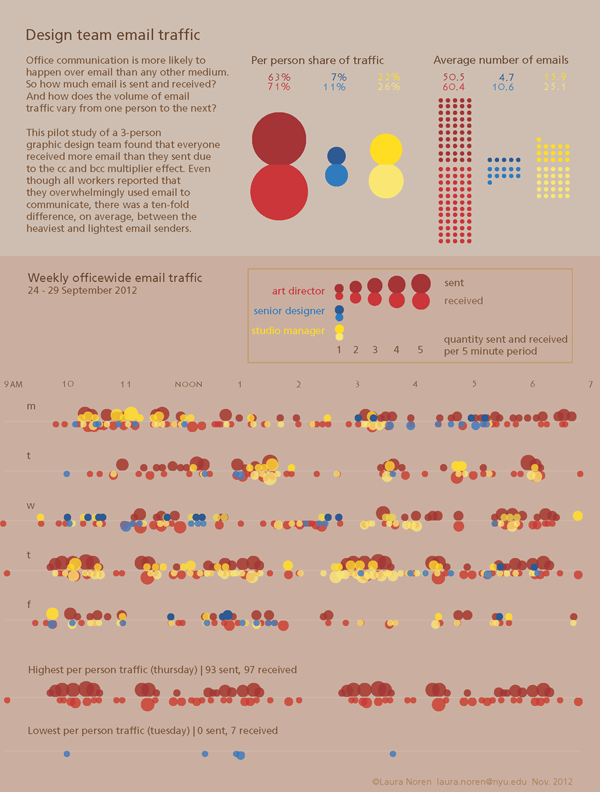
I started to realize that the timelines were difficult to analyze so I went back to the data and pulled out some summary statistics about the average number of emails each person sent and received. I also thought it would be interesting to see how much of the officewide traffic each person generated. While I was looking for new ways to help people understand what they were looking at, I also showed them the range of reality in the same timeline format by pulling out the lines for the highest traffic person-day and the lowest traffic person-day. I also remembered one of the lessons I learned from reading Nathan Yau’s Visualize This and added some descriptive text. [A full review of that book is here.]

Office email traffic

This is as far as I have gotten. But if I get good suggestions in the comments, I’ll keep improving.

What can writers learn from graphic designers

Getting through this many drafts alone was hard. It is very hard to see the same thing with new eyes. I got some help from two different people and even though neither of them said much, their opinions made a huge difference in the process. I encourage writers to find a way to share their work with others earlier in the process. It is humbling. If the comparison to graphic design is apt, earlier sharing either of the whole draft or of smaller sections will also likely lead to a stronger piece that gets written faster.

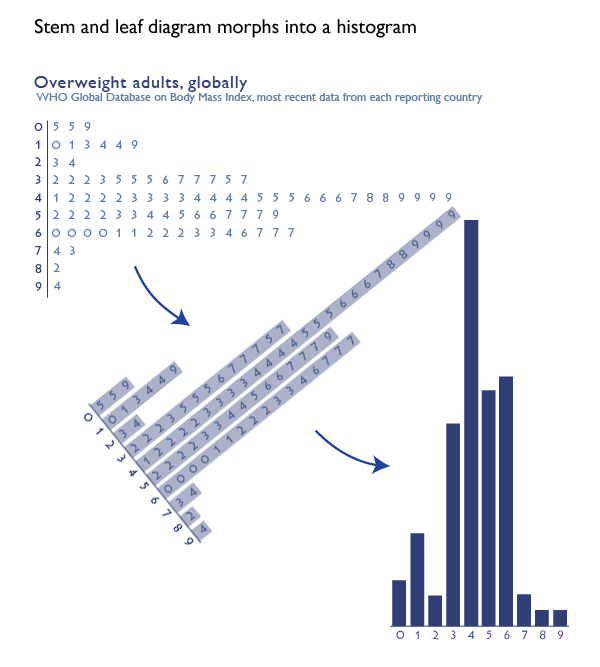
Stem and leaf diagram becomes a histogram

What works

The stem and leaf diagram is an old stand-by that has largely been abandoned in social science as it morphed into the histogram. It is a rather ingenious graphical device that could be created even with a typewriter, which is how people used to prepare documents not that long ago. And when I say ‘people’ used to prepare documents, I am actually imagining wives and girlfriends of the husbands and boyfriends who were preparing final drafts of their dissertations and later the (mostly female) secretaries, administrators, and lab assistants typing up articles and figures for (mostly male) professors. [Refer to this graphic on the gendered nature of degrees at the doctoral level for supporting evidence that it was mostly men writing dissertations and then getting the jobs available to people who had written dissertations.]

How to make a stem and leaf diagram

1. Start with numerical data. Organize it from least to greatest.

2. Think of each number as having a stem and a leaf. The stem is the more durable part of the number and the leaf is the more sensitive part of the number. For a number like 57, the more durable part of the number is the ‘5’ because even if there was some variation in the measure, the number in the 10’s spot might not change but the ‘7’ in the singles spot is more sensitive and thus more likely to flutter like a leaf. If we were measuring temperature, for instance, it would be a lot more likely that the day would have temperatures like 56 and 58 than 60-something and 40-something. Thus, the tens spot is the stem and the singles spot is the leaf in this case. It would be possible to use measurements in the hundreds or even thousands.

3. Once you have identified your stems and leaves, type the lowest stem value. Then type a bar or some other vertical device to separate your stem from your leaves. Then look at all the observations you have for that stem value. Type in every single observed leaf value for that stem, starting with the lowest one. So if you are creating a diagram of all the temperatures registered at noon for the month of November, you will have 30 values to stick in your chart. You will probably have something like three values in the 30s – say, 35, 37, and 38. This would mean you would type a 3, then a vertical bar, then 5, 7, and 8. If there were also nine values in the 40s – say 40, 41, 42, 42, 43, 45, 45, 46, and 48 you would hit carriage return. Then you’d type a 4, a vertical bar, and 0 1 2 2 3 5 5 6 8. You see how people (mostly women) could use typewriters to make graphics.

The strength of this technique is that it forces the actual dataset into a visually organized diagram. All of the values can be read right out of the graph but the device as a whole gives an impression of the overall pattern.

4. At some point after typewriters, the stem and leaf diagram morphed into a histogram. I think Excel had something to do with this, but I am still researching just how it was that the stem and leaf diagram was relegated to the dustbin while the histogram rose to take its place.

Worth thinking about

Stem and leaf diagrams are close cousins of bar charts and histograms. While bar charts and histograms might be more attractive in some ways, they are, in fact, less data-rich. It is not possible to read the actual values out of a colored bar. Despite the fact that the histogram chart form *could* be more visually pleasing than the stem and leaf diagram the fact that histograms allow more space for aesthetics means that they can just as easily be uglier, not more appealing, than stem and leaf diagrams. Dumb and ugly is no good at all. Still, bar charts gave rise to things like stacked bar charts that allow us to visualize observations for multiple investigations that share the same variables so I do not consider them a step backwards.

What about global body mass index?

The information in the graphs above comes from the World Health Organization’s database of global body mass index. The numbers represent the percentage of people in the overweight or obese range of the body mass index in individual countries, NOT the average body mass index of individual countries. Notice that one country [American Samoa] has over 90% of its adult population in the overweight or obese range. If you’re curious, the US has 66.9% of our adults in the overweight+obese range. Vietnam is on the low end with only 5% of its adults overweight or obese.

References

World Health Organization Global Database on Body-Mass Index. [Last accessed 17 November 2012]

Graphic: Gender ratio of recent US graduates by degree
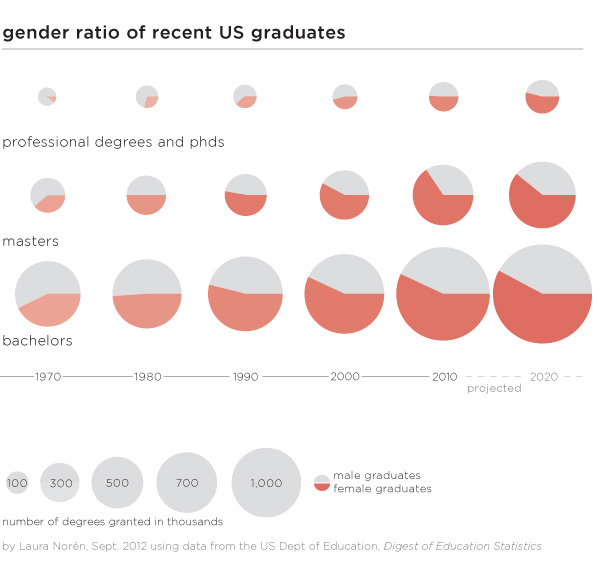
Gender ratio of recent US graduates by degree | Laura Norén | click caption for pdf

Is higher education “dominated” by women?

There has been plenty of news coverage recently about the rise of women and the decline of men. While I have always disliked the irrational use of zero-sum language – why do we have to frame this discussion as men who are losing because women are making some gains? – I thought it would be worth taking a closer look at the gender ratio in higher education. I found many text-heavy stories (the Guardian, the New York Times, the Chronicle of Higher Ed, Huffington Post, The Atlantic, and many others) about female students earning more bachelors but surprisingly few graphics.

Graphics can do an excellent job of summarizing the gender gaps as they have developed over time within bachelors, masters, and professional+doctoral degrees. One graphic, quite thought provoking. All of the three degrees were more likely to be earned by men in 1970. Then between 1970 and 1980 women made rapid gains which continued through the 1980s. The gains for women slowed down once they hit the 50/50 mark for both bachelors and masters degrees and I predict they will also slow down for phd and professional degrees. Though it’s hard to tell by looking at the graphic, women are earning the largest proportion of masters degrees (projected to be 61% in 2020) which is slightly more than the 58% of bachelors degrees they are projected to earn in 2020.

Why aren’t women earning more if they are so well educated?

There is still a pay gap in earnings between men and women. Within the university, male faculty members tend to make slightly more than female faculty members. Overall, the most powerful explanation for pay gaps is not so much a failure to pay men and women equally for the same job. Rather, women are more likely to get degrees that lead to positions which are paid less than the positions men are more likely to get following their collegiate specializations. More women end up in education and nursing; more men end up in engineering and computer science. Education and nursing are not as likely to be lucrative as jobs that require engineering and computer science degrees.

To answer the question about women “dominating” higher education it is clear from the numbers that there are more female students at every level, though some majors still tilt towards men. What’s perhaps more important, women may or may not go on to match the earning potential of men, in part because they may not always choose the majors that lead to the most lucrative careers. Some argue that earning potential should drive choice-of-major but I’m still of the mind that going to school is not all about (or even primarily about) producing good workers. Going to school is about taking the time to explore different ways of thinking in depth and without undue concern for their ability to produce economic return. I’m glad that we have gotten to the point where there is enough gender parity to return to conversations about what school is for rather than who school is for…

Does the gender gap in graduation rates vary by race/ethnicity?

Graphic: 2009 US bachelors degrees by race/ethnicity and gender
2009 US bachelors degrees and gender gaps by race/ethnicity | Laura Norén | click caption for pdf

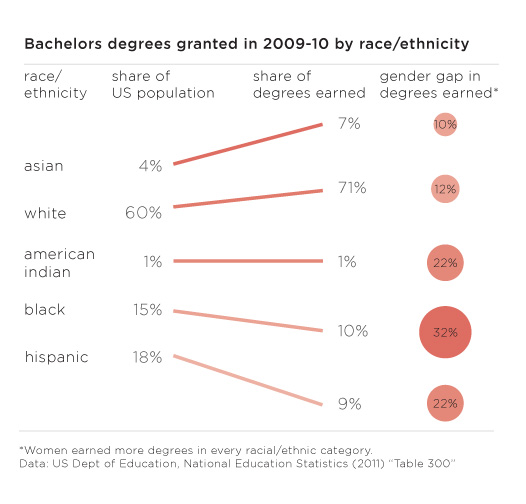
…but on the other hand, there are still critical gaps in access to higher education and degree completion that trend along racial/ethnic lines (class lines, too, but I didn’t get into that in this post). The graphic above displays the share of bachelors going to different racial/ethnic groups in 2009. In order to provide a relevant framework for comparison, I plotted the share of degrees earned next to the share of the total population of 18-24 year olds constituted by each racial group. There are some missing categories – mixed race people, for instance – but I couldn’t find graduation rates broken down any further than the five traditional racial/ethnic categories. Asians and Pacific Islanders only make up 4% of the population but they earn 7% of the bachelors in 2009 and their gender gap that year was only 10%. Whites were similarly over-represented in degree-earners and had a similar gender gap of 12%. But then things got interesting. The gender gaps for American Indians and Hispanics were much higher at 22% and the gender gap for blacks/African Americans was even higher still at 32%.

Especially when it comes to studying gender which is often constructed as a binary in which both groups make up about 50% of the whole, it is important to realize that analytical rigor might be increased by further segmenting these gender categories by some other key analytical variable. In this case, adding vectors for race/ethnicity provided a new perspective, one that might be a decent proxy for class.

References

Norén, Laura. (4 September 2012) Gender ratio of recent US graduates [infographic] New York.

Norén, Laura. (4 September 2012) US bachelors degrees by race/ethnicity [infographic] New York.

National Center for Education Statistics. (2011) Table 283: Degrees conferred by degree-granting institutions, by level of degree and sex of student: Selected years, 1869-70 through 2020-21 [Available in html and xls] US Department of Education.

National Center for Education Statistics. (2011) Table 300: Bachelor’s degrees conferred by degree-granting institutions, by race/ethnicity and sex of student: Selected years, 1976-77 through 2009-10 US Department of Education.

US Census Bureau. (2012) Table 10: Resident Population by Race, Hispanic Origin, and Age: 2000 and 2009 In The 2012 US Statistical Abstract. [Available in pdf and xls.

Food blog content characteristics and frequency of use | The Food Blog Study

What works

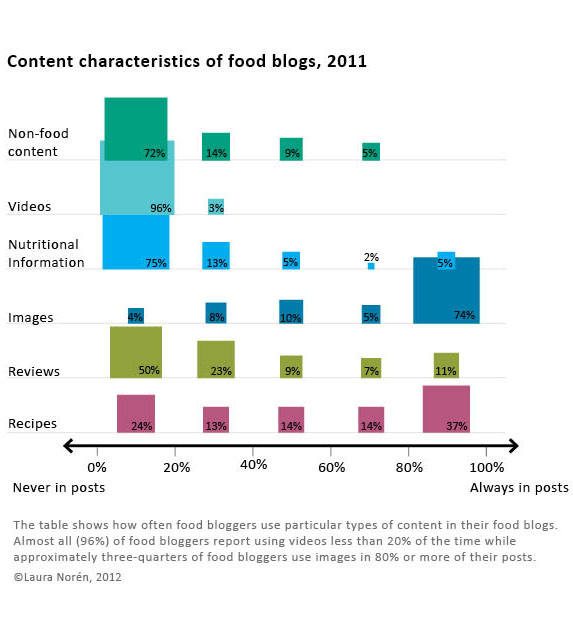
I conducted a web-based survey of food bloggers last summer as a doctoral intern at Microsoft Research in the Social Media Collective. I am now analyzing the mountains of data that I gathered in the interviews (N=30), survey (N=303), and web crawler (N=30,000) and getting ready to send out papers for publication. I thought it would be nice to share some of the findings here in advance of the slow academic publishing process.

Since I made the graphic and since I am modest, I’ll just say that I like the colors and I like that I was able to find a way to keep all of the granular detail of tabular data while adding visual impact.

If you would rather hear about the substance of the study than about the struggles I had while creating the graphic, skip to the bottom third of the post and the “What surprised me” heading.

What needs work

Since I have the benefit of having seen the data I can say that two things certainly need work. First, the survey asked about many more behaviors than I have decided to depict in this graphic. I left out data mostly because I want to be able to publish it and publishers are not keen on accepting already-published material. Some of them are not too bothered if bits and pieces of the findings are blogged about here and there. Some of them are hugely bothered and will not accept submissions that have been written about on blogs at all. There are good reasons for subjecting the findings to peer-review – like having smart people verify that the findings are not fabricated from thin air or otherwise constituted by complete rubbish. All that being said, my biggest problem with this graphic is that it is just the tip of the iceberg in terms of what the survey had to say about the characteristics of food blog content.

The second big problem with this is that I had a very difficult time dealing with proportional data in the rows and the columns. In case you still haven’t figured out what this graphic is saying – and I don’t blame you if you find it hard to digest – the graphic is depicting the frequency with which about 300 food bloggers (303 to be exact) reported using the listed types of content. For example, 96% of food bloggers report using video 20% of the time or less. Video just is not all that common on food blogs and most food bloggers hardly ever use it. Images, on the other hand, are included in food blog posts most of the time by most food bloggers. Seventy-four percent of food bloggers use photos 80% of the time or more. Reviews of restaurants, cookbooks, and kitchen gear, on the other hand, end up on 11% of food bloggers posts very frequently (80% or more posts contain reviews) while fully half of food bloggers hardly ever post reviews (20% or fewer of their posts contain reviews).

Since most food bloggers like to mix things up at least a little – hardly anyone has such a firmly established template for their blog content that 100% of their posts contain recipes and photos while 0% of their posts contain videos or discussion of non-food content (which would include mentions of important life events like getting a book contract, having a child, getting married, or getting cancer). With content, then, I wanted to let food bloggers explain about how often they posted a variety of different kinds of content. But then I had this difficulty of having proportions in the rows and the columns of the graphic which makes it difficult to interpret. Believe me, the tabluar data without the blocks changing sizes and colors was even harder to interpret so turning this information into a visual did help the analysis along by making the patterns clearer.

What surprised me

I was expecting many more bloggers to report including recipes more often. Only 37% said that 80% or more of their posts contained recipes. From what I gathered in the interviews, having someone else make your recipe and then leave a comment about it is one of the routine gratifications associated with food blogging. Web traffic to the site from google.com and on mini-search engines within the site is generally related to recipes, as well. So whether food bloggers care about the deeper meaning associated with food blogging and being part of a community or the hard-nosed economics and web traffic side of writing a blog, from the interviews, I was expecting recipes to be a bigger part of reported content than what I found in the survey. Recipes are one of the main activities around which both creativity and community are wound. They also draw a lot of traffic. On blogs, traffic often equals money (though not all that much money, which is why I think the meaning associated with recipes is more interesting than the money associated with recipes).

I was not at all surprised that most bloggers ignore nutritional information but I think that people who have never done much with food blogs would be surprised to see that three-quarters of bloggers mention nutrition and nutritional information 20% of the time or less. Food blogging gets its meaning and importance through practices of creating and community-making, not because the blogs are used as archives or tracking devices for those trying to lose weight or achieve other health goals. There are blogging communities organized around those things, but generally speaking, folks in those communities do not identify with the term ‘food blogger’.

Reference

Norén, Laura. (2012) Infographic: The Content of Food Blogs. The Food Blog Study. [www.foodblogstudy.info/findings.html]

Saveur food blog award nominees and winners by gender, 2010-2012

Gender in food blogging

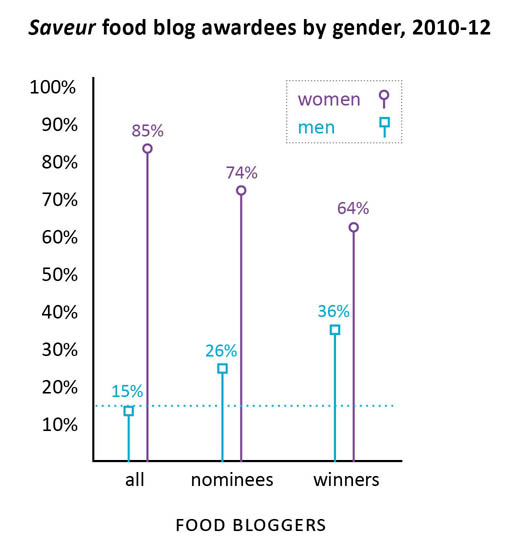
Last summer I conducted a survey of food bloggers (N=283) which found that 85% of food bloggers are women (see here for more demographic statistics from the survey). I also conducted interviews with food bloggers and started to get the impression that food blogging is a community dominated by women in which the relatively few men end up being disproportionately successful. This kind of gender disparity – a group that is overwhelmingly women in which men are more likely to occupy positions of power or prestige – has been written about in the sociological literature with respect to elementary school teaching and nursing. In elementary schools, for example, the majority of the teachers were women but administrators (like the principal and vice principals) were disproportionately likely to be men. This gender disparity in the schools is no longer as pronounced as it once was. Women now occupy more of the administrative positions but men have not moved in to occupy more teaching positions. If food blogging follows the same trajectory, we can expect women to occupy more of the most prominent food blogging positions over time.

But what is a ‘prominent food blogging position’?

Since food bloggers are not working professionals within a clear hierarchy like teachers and nurses, I decided to look at food blog awards data as a proxy for success in the food blog world. The magazine Saveur hosts the longest running, most extensive set of food blogging awards of any organization. I used their awards nominees and winners to pull together the graphic above and find out how gender and success in food blogging interact.

Using the Saveur awards data, it is clear that there is a pattern of disproportionate male success within the food blog nominees and winners. In a perfectly gender-neutral world, we would expect that when 15% of the food blogs are written by men, 15% of the food blogging awards will be distributed to men. In fact, 26% of the nominees (chosen by Saveur) were men and 36% of the winners (voted on by the internet audience) were men. In other words, both the Saveur selections and the internet-audience voters were inclined to select men more often than strict chance would have predicted.

My interviews indicated that there could be a few explanations for this kind of pattern. However, I’m curious to hear what food bloggers – especially those who voted for or won Saveur‘s awards – have to say.

The comments are open.

Methodological note

N=194

I removed blogs whose writers’ genders were not revealed and blogs written by couples or other mixed-gender groups. I also removed blogs that did not meet my original definition of food blog which include the two categories for blogs about alcohol and the category for blogs about kitchen tools/gadgets.

References

Saveur Food Blog Awards 2012.
Saveur Food Blog Awards 2011.
Saveur Food Blog Awards 2010.

Norén, Laura. (2012) Saveur food blog award nominees and winners by gender, 2010-2012. [Blog post] Graphic Sociology blog.

New York Times 100 Notable Books - Authors' Academic Affiliations

What works

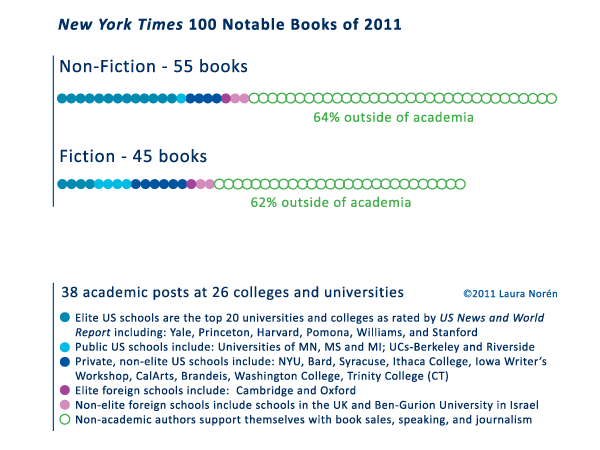
Using the New York Time’s list of 100 Notable books of 2011 that ran over the weekend as part of their Holiday Gift Guide, I created the graph above. As an almost-academic, I am interested in the scope of academic work and found it interesting that less than half of the notable books were written by people with academic affiliations. Michael Burawoy and Craig Calhoun have both called for new roles for scholarship and the university, emphasizing that an academy unhitched from the public sphere is not a viable model and might very well be considered irresponsible, given the scale and scope of social, scientific, and technological challenges facing the globe right now and for the foreseeable future.

So what does it mean that non-academics are writing more of the notable books than are academics?

I cannot answer that question definitively, but I can offer three possible avenues for exploration. First, it could be that academics are irresponsible or lazy and that they have either failed to write well or to address relevant topics. They are off publishing pedantic articles in academic journals that nobody reads to fill out their CVs. This scenario is grave. There is an element of truth to it.

An alternative explanation would be that, in part because this is a *gift* suggestion list, these books are not necessarily the most important, but they are the most well written. If that is the case, then the fact that so many non-academic voices make the list indicate that writing itself is an art, one that is spread much more judiciously across the American populous than are academic positions. It also suggests that thinking clearly and writing well are going on in all sorts of places, not just the ivory tower. This is encouraging. There is an element of truth to it.

A third version of this story begins where the second one left off and suggests that, in fact, if academic books do appear on holiday gift lists of notable books, those academics are shirking their duties as academics. Any book with broad public appeal probably is NOT doing much to advance a field. It’s probably just regurgitating existing research in a kind of “Research Thought X for dummies” kind of way. [Many of the people who adhere to this line of thinking have deep and abiding negative thoughts about Malcolm Gladwell.] The view from this perspective argues that asking academics to be responsible to public audiences is akin to asking people to text and drive. It’s dangerous. It takes one’s eye off the critically important field of action and reorients it, likely towards one’s own navel. The primary activity – analytical research and publishing – will suffer, perhaps taking down innocent bystanders along the way. This is a fairly rigid understanding of the best practice for academic research. There is an element of truth to it.

I invite debate on the points I mentioned and those that I have overlooked in the comments.

What needs work

This graphic is not as elegant as I would like. There are far too many words.

I am fascinated with the nitty gritty details of the schools at which those with academic appointments are working. Including the names of so many schools made the endnotes lengthy. I am of two minds on that. Like I said, I enjoy knowing the details, especially when it comes to fleshing out a category like “Elite.” It’s important to know just how eliteness has been defined. In this case, I used US News and World Report. With respect to most of the schools – Princeton, Harvard, Yale, Oxford, Cambridge, Columbia – I think there is widespread agreement that these schools are at the top of the academic heap and have been for a while. Some might quibble about Pomona and Williams.

The point I was trying to illustrate was that those in academia who have books on the notables list could be seen to be public intellectuals or at least they are doing better at making their work accessible to the public than their colleagues who never make it to such lists. It is especially important that the professors in elite institutions make their work accessible because, unlike their colleagues at public schools or less exclusive private schools, the metaphor about the ivory tower as a mechanism of separation is apt. Very few of us have access to elite institutions. Some have argued that those in academia have some responsibility for making their work accessible to broader publics.

References

Burawoy, Michael. (2005 [2004]) http://ccfi.educ.ubc.ca/Courses_Reading_Materials/ccfi502/Burawoy.pdf [Presidential Keynote Address at the Annual Meeting of the American Sociological Association] American Sociological Review Vol. 70.

Calhoun, Craig. (2006) “Social Science for Public Knowledge”>The University and the Public GoodThesis Eleven Vol. 84(7).

New York Times, Sunday Magazine. (November 2011) “100 Notable Books of 2011” [Holiday Gift Guide]

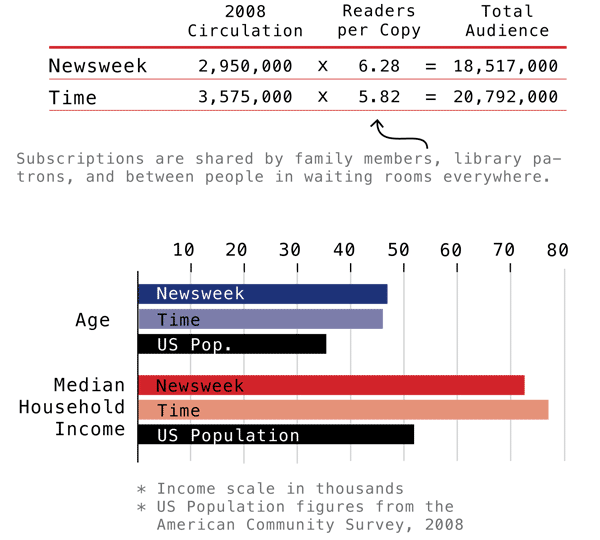
Time and Newsweek Circulation Figures | Graphic by Laura Norén
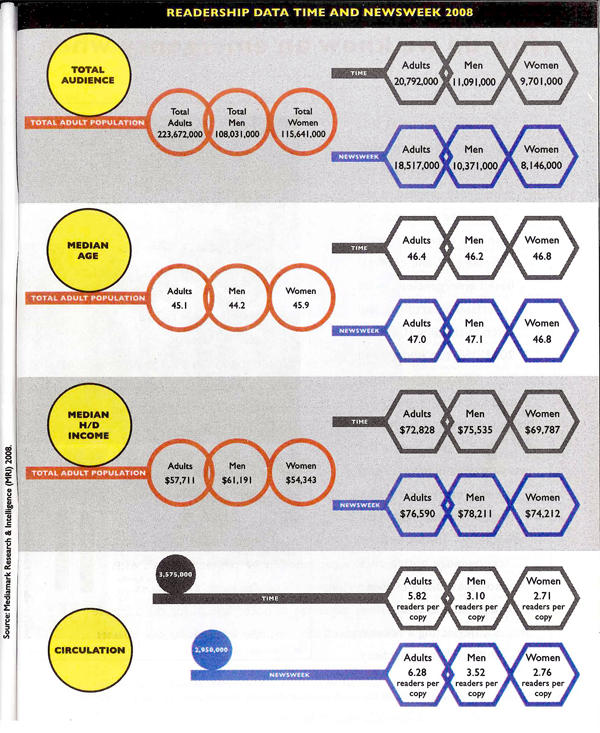
Newsweek and Time Circulation Figures | Graphic by Yolanda Cuomo

Which one works?

These two graphics portray some of the same information – household income, median age, audience and circulation – though the first one does not break down information between genders. Though it probably goes without saying, I like the one I designed best. The second one has some tantalizing shapes – I applaud the visual appeal – but it does nothing to aid people’s eyes as they try to compare relative sizes between the salient categories. I also happen to think it is easier to understand the complexity of the difference between audience and circulation with the textual explanation provided in the first one. I find the white-font-on-dark-background of the Time and Newsweek labels hard to read (it’s also a known graphic design no-no, especially with a small font size like this. It is easier for the human eye to grok the contrast with dark text on a light background than with light text on a dark background).

From a sociological perspective, comparing the readership of Time and Newsweek not only to each other but also to national averages provides a much deeper sense of context. The second graphic was built from the first though I never had a chance to meet with any of the writing or design team to understand why the national averages were removed.

There are other elements I dislike in the second one. I dislike, for instance, the need to repeat certain elements of text over and over again: “readers per copy” and “Total adult population” and even the “Time” and “Newsweek” headings. One of my closest friends and colleagues spends a lot of his time writing code. The best lesson I have learned from him is that where elements or actions have to be repeated over and over, there is inefficiency in the system. A better design is possible.

I would love to hear from my readers on this comparison. Am I suffering from too much ego investment in the graphic I made? Is the second graphic an improvement on the first? If so, how?

References

Norén, Laura. (2010) “Appendix: Data and Methods” in first draft of Dill, Nandi and Telesca, Jen Imagining Emergencies. [Information graphic].

Cuomo, Yolanda. (2011) “Readership Data Time and Newsweek 2008” in final draft of Dill, Nandi and Telesca, Jen Imagining Emergencies. [Information graphic].

Beans
Beans

Overview

On Tuesday I read “When One Farm Subsidy Ends, Another May Rise to Replace it” OR “Farmers Facing Loss of Subsidy May Get New One” by William Neuman [aside: why does the NY Times frequently have two titles for the same article? One appears in the title tags in the html and in the URL, the other appears at the top of the article as it is read]. The upshot of the article is that the subsidies appear to be curtailed as cost-saving measures but come right back under new names:

It seems a rare act of civic sacrifice: in the name of deficit reduction, lawmakers from both parties are calling for the end of a longstanding agricultural subsidy that puts about $5 billion a year in the pockets of their farmer constituents. Even major farm groups are accepting the move, saying that with farmers poised to reap bumper profits, they must do their part.

But in the same breath, the lawmakers and their farm lobby allies are seeking to send most of that money — under a new name — straight back to the same farmers, with most of the benefits going to large farms that grow commodity crops like corn, soybeans, wheat and cotton. In essence, lawmakers would replace one subsidy with a new one.

Neuman also interviewed Vincent H. Smith, a professor of farm economics at Montana State University who, “called the maneuver a bait and switch” saying,

“There’s a persistent story that farming is on the edge of catastrophe in America and that’s why they need safety nets that other people don’t get. And the reality is that it’s really a very healthy industry.”

My curiousity was piqued, to say the least. Farm subsidies have long been an emotionally charged issue – Professor Smith is right to point out that the family farmer is an icon in the American zeitgeist whose ideal type gets trotted out as a narrative to support subsidies that often go to large-scale corporate agriculture. Before mounting my own angry response to what appears to be both hypocritical and a well-orchestrated marketing schmooze (ie the public proclamation by various farm lobbies that they are willing to take fewer subsidies as they band with the rest of the beleaguered American public in a collective belt-tightening process while simultaneously opening up other routes to receive the same amount of funding through different mechanisms), I decided to go in search of some hard data to see what is going on with agricultural subsidies.

Agricultural data

I found two great sources of data. First, the USDA runs the National Agricultural Statistics Service which publishes copious amounts of tables full of information about how much farmland there is in the US, what is grown on it, what the yields are, what commodity prices are, what farm expenditures are doing, and all sorts of rich information. Linked from the article was another source of data – the Environmental Working Group – which has been tracking farm subsidies for years. The Environmental Working Group also relies on the National Agricultural Statistics Service, especially for farm subsidy information. Between those two sources, the US Census, and the 2012 US Statistical Abstracts (Table 825 especially), I had more than enough information to start putting together a graphic that could describe at least part of what is going on with agricultural subsidies.

Selecting the right data

Because farming is distributed unevenly around the country, I knew I needed to come up with a set of numbers that went beyond absolute dollar amounts per state. Probably it would have been nice to see where subsidies go per crop, but other people have already done that.

To look at agricultural subsidies overall, and to work with the state-by-state data that I had, I ended up considering three approaches.

  • 1. Absolute commodity subsidy amounts per state.
  • 2. Commodity subsidy amounts per capita.
  • 3. Commodity subsidy amounts per farmland acre.

It is obvious that the third option, looking at the amount of spending per acre within each state, is the best.

Hypothesis

I expected to find that states with small amounts of farmland would be relatively more expensive per acre than states with large amounts of farmland. I assumed there would be economies of scale and that states with very large amounts of farmland probably had a lot of that land dedicated to pasture, which is pretty cheap to maintain compared to something like an orchard.

Attempt Number 1

I decided that simply showing the costs per acre might not be as interesting as keeping the absolute amount of farmland in play and doing some kind of comparison.

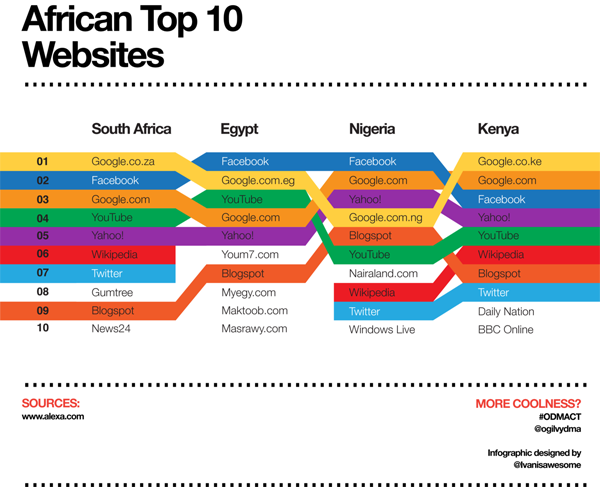
Rank comparisons are extremely popular and I admit I was sucked into them, though now that I’ve tried to make them, I kind of hate them. These are the kinds of comparisons that you’ll hear on the news – Ohio ranks Yth in per capita income but Zth in educational spending per pupil – and see in graphics that often look like this:

Top Ten Websites in Four African Countries | Ivanisawesome

My first attempt to do something similar looked like this.

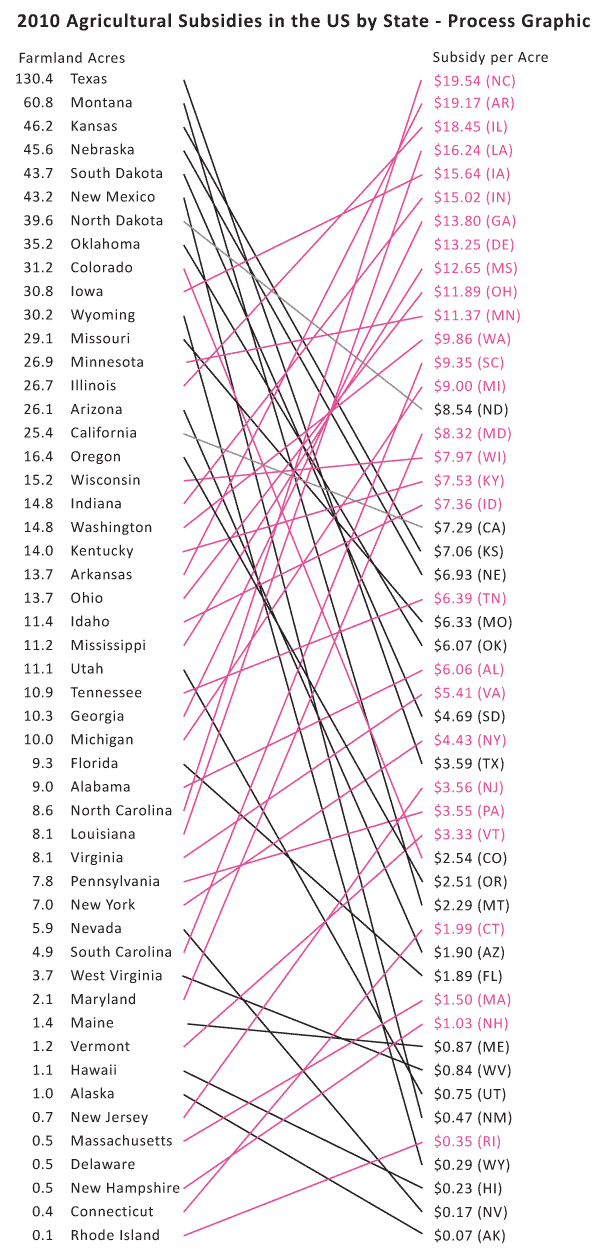
US Agricultural Commodity Subsidies | Process Graphic 01

Here are my problems with it:

  • There is no obvious pattern – it looks like a rat’s nest.
  • The states with bad ratios – the ones where we are paying more than $10/acre – have upward sloping lines connecting them from the left column to the right column. Psychologically, the ‘bad’ deals should have downward sloping lines. It just makes better visual sense.
  • Pink was supposed to be along the lines of red on accounting sheets but it looked too cheery to indicate being ‘in the red’.

Attempt Number 2

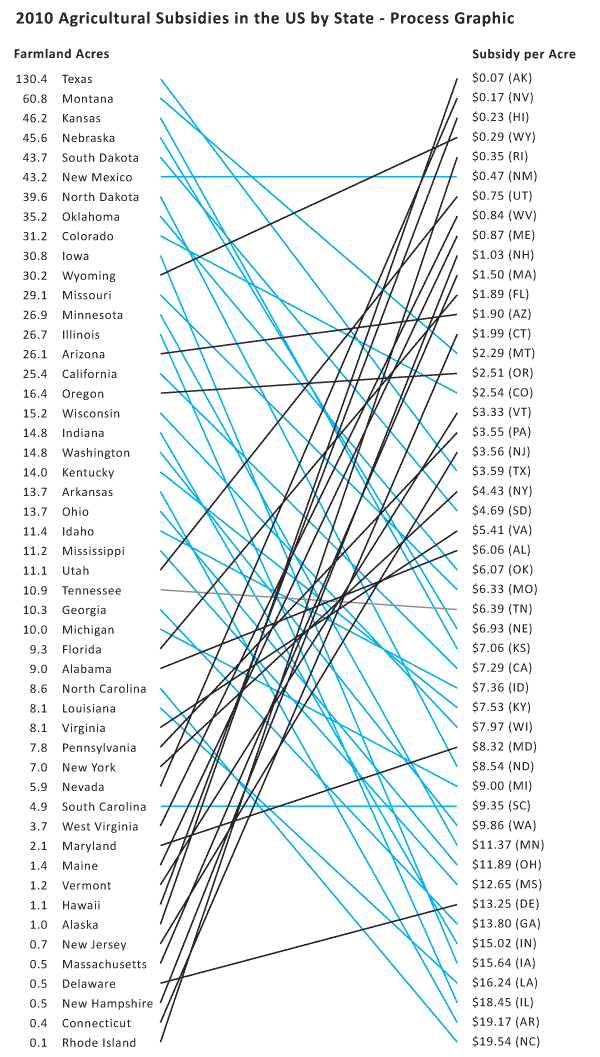
US Agricultural Commodity Subsidies - Process Graphic 2

I got rid of the pink altogether and flipped the scale on the left so that the best deals – the lowest per acre subsidy costs – are at the top. This means that states that are taking less per acre end up having upward sloping lines more often than downward sloping lines.

Thinking through this brought up some larger concerns. Comparing by rank alone is ridiculous. The space between each listing in both columns is extremely critical in a graphic like this and needs to be scaled appropriately. For instance, look at Alabama ($6.06) and Oklahoma ($6.07) in the right hand column. They basically have the exact same amount of spending per acre and yet they are the same distance apart as Washington ($9.86) and Minnesota ($11.37). The same problem happens in the lefthand column – states with about the same amount of acreage dedicated to farmland have the same distance between them as states with large differences in the amount of acreage they have dedicated to farmland.

Attempt 3

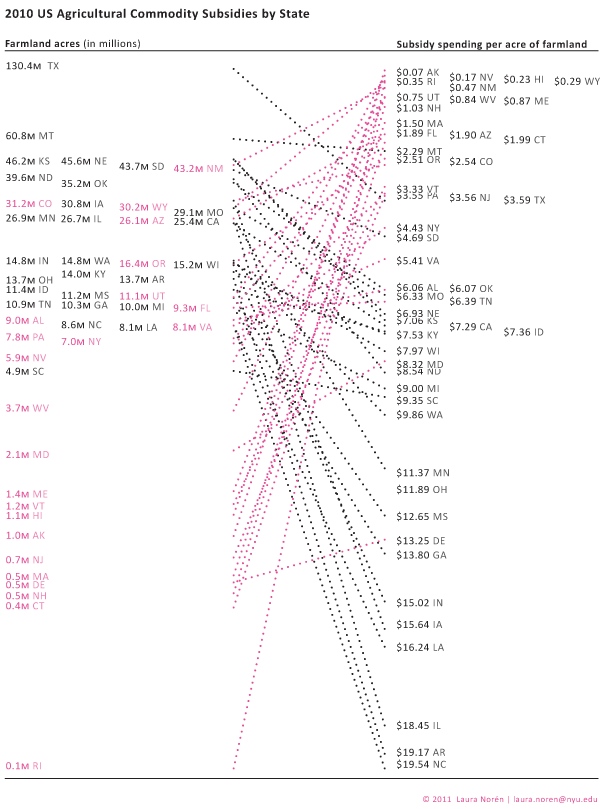
US Agricultural Commodities by State, 2010

Click here to see a pdf of the whole graphic.

I scaled both the right and left hand columns using a log scale for farmland acreage (though the number of acres is still given in absolute millions of acres – only the visual arrangement was logged). The pattern is still messy and hard to discern, though clearer than in previous versions. In order to bolster the pattern, I turned the ‘good deals’ in the lefthand column pink. The states with less acreage dedicated to farmland routinely receive less subsidy per acre than some of the bigger states. But the very biggest farming states – like Montana and Texas – are also pretty affordable on a per acre basis. It was states near the middle of the pack that were coming in at $18 and $19 per acre of commodity subsidy spending.

I thought maybe it was a weather event that led to some of the larger subsidies. But if that were the case, states that were geographically near one another would probably have had the same drought/hurricane/flood and should have received similar funding. There is work to be done on the weather question – looking at data over time would be a good step in the right direction there.

However, I don’t know that weather is going to be the best answer to this question. Look at Washington and Oregon. They are geographically right next to each other, grow some similar kinds of things, and have a similar amount of farmland acreage yet they have dramatically different amounts of subsidy spending per acre. Washington takes $9.86 per acre; Oregon gets $2.51 per acre. It’s still unclear why there is such a great disparity between these two states in 2010.

Falsified hypothesis

Through the construction of this information graphic, I falsified my own hypothesis. The states with the smallest amount of land dedicated to farmland received the least amount of commodity subsidies.

I have some thoughts about what is going on. They will require more data analysis and graphic development to suss out and represent completely.

    New Hypotheses

  • 1. It’s the weather. It could still be the weather. I did not do enough investigation into this variable, though this seems like a weak hypothesis.
  • 2. It’s corn. The states that grow a lot of corn seem to get more subsidies. This hypothesis could easily be expanded to be something more sophisticated such as: “Subsidies per acre are sensitive to the commodity grown.”
  • 3. It’s lobbying. The states that are known to be “big farm” states seem to have more funding than smaller farm states. Maybe they are better represented by the farm lobbies and therefore end up with more subsidy per acre than states without strong representation from the farm lobby. This hypothesis has an overlap with the “it’s corn” hypothesis.

Conclusion

There are two kinds of conclusions to be drawn. On the agricultural front, it is safe to conclude that Americans spend a good bit of money per acre of farmland; there is no free market on the farms. Bigger states do not offer economies of scale compared to states with less farmland acreage. No additional conclusions can be drawn from this limited data, though interesting hypotheses can be posed about the influence of local weather events, funding for specific commodities like corn, and the impact of lobbyists efforts on agricultural funding allocations.

As a graphic exercise, I hope I have proven that rank orderings do not offer much analytical value on their own. I hope I have also suggested that graphics can be used not only for representing findings at the end of the process but for discovering patterns. Graphics are not just for display, they are also for discovery.

References

Neuman, William. (2011, 17 October) “When One Farm Subsidy Ends, Another May Rise to Replace it” Business Section, nytimes.com.

Noren, Laura. (2011) US Agricultural Commodity Subsidies by State, 2010“US Agricultural Commodity Subsidies by State, 2010” [Information graphic] and [Data Table – this is a combination of data and analysis originally published by the National Agricultural Statistics Service, a public-facing branch of the USDA].

Environmental Working Group a good source for information on agricultural subsidy spending.

United States Census Bureau, Statistical Abstract of the United States (2011) Agriculture.

United States Department of Agriculture, National Agriculture Statistics Service

Food Blog Study Descriptive Statistics Part 1 - Blogger Demographics

What works

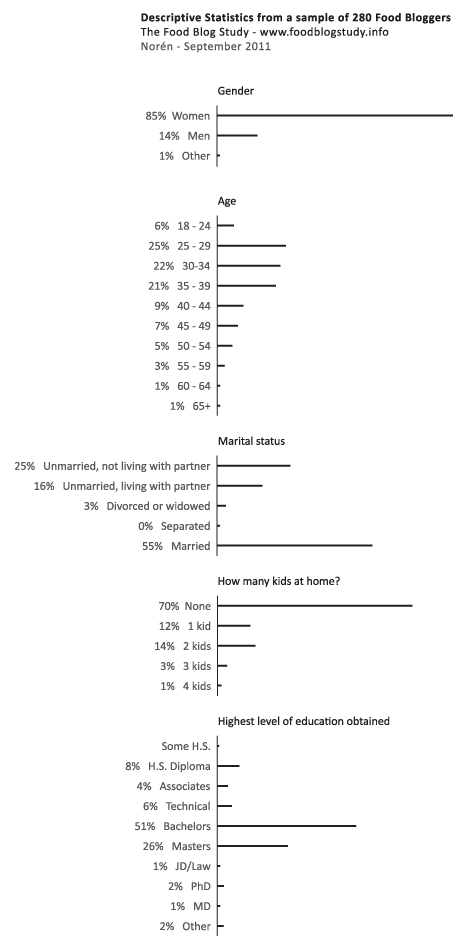
Over the summer I surveyed 280 English-speaking food bloggers who were randomly drawn from a network of 23,000. Only the bloggers with email addresses, contact forms, or twitter accounts were invited to participate (obvious reasons…if I couldn’t get in touch with them, I couldn’t invite them to participate).

The graphic above represents my first attempt to present some of the basic descriptive statistics – gender, age, marital status, educational attainment, number of kids – just to see what works visually. Normally, this kind of information is presented in tables (I have those, too), but I wanted to try to add some horizontal bar graphs for impact. I kept them horizontal so that the axes labels would be easier to read.

The percentages are listed; the frequencies are represented visually.

Just for comparison sake (which is kind of difficult): the average age of people in the US is 37.2 (it’s 38.5 for females); about 50.5% of Americans are married now and only 2.5% are cohabiting. As for education, 28.5% didn’t get another degree after H.S., 17.7% stopped after their bachelor’s degree, and 10.4% have professional degrees. Clearly, the food bloggers are well-educated and more likely to be cohabiting than the American averages. I added these comparisons in response to Rob’s request. I know it would have been better to add them to the graphic, but the comparisons are a little tricky because the Census data is looking at a wider age range and I haven’t found any good summary stats on bloggers in general (which would be better than the aggregate comparison to the whole national pool).

What needs work

This strategy would not work for the entire set of variables – boring after a while. I am trying to think of better ways to show more variables at once without just building a column that goes on and on forever.

For more on “what needs work” see the comments section.