health care

Visualizing How A Population Grows To 7 Billion | NPR [Click for video]
Visualizing How A Population Grows To 7 Billion | NPR {Click for video}

What works

This video does an excellent job of explaining how population growth has happened with beautiful visualizations. Click through to watch it. It’s worth it.

Visualizing How A Population Grows To 7 Billion | NPR [Click for video]
Visualizing How A Population Grows To 7 Billion | NPR {Click for video}

What comes next

It would be nice to have a visualization that could combine population growth visualizations with quality of life visualizations. Quality of life was pretty dismal in the beginning – infant mortality was high, maternal death was high, life times were short and much more of them were spent in grueling conditions. The rising tide of domestic agricultural practices raised all boats. But then quality of life started to become stratified – some people in some places had it pretty good while others were still facing not such great conditions. Now quality of life is extremely stratified but starting to diminish globally and will continue to diminish as the impacts of climate change set in (not to mention the non-climate related concerns associated with what happens when the planet starts to reach its limit in terms of how many human lives it can support at high levels of ‘quality of life’). Fewer people will be able to eat meat regularly (which may or may not be considered an indicator of high quality of life), more people will get asthma as we all move to cities congested with the exhaust of internal combustion engines and coal-fueled power plants, more people will live in drought stricken places, and more people will end up in conditions of poverty if rates of inequality continue as they are.

The video is beautiful as it is. But the beautiful polish helps obscure the notion that population growth is not necessarily a good thing.

References

Cole, Adam and Starbard, Maggie. (31 October 2011) Visualizing how a population grows to 7 billion. NPR.org.

Cost of Health Care by Country | National Geographic

Explanation

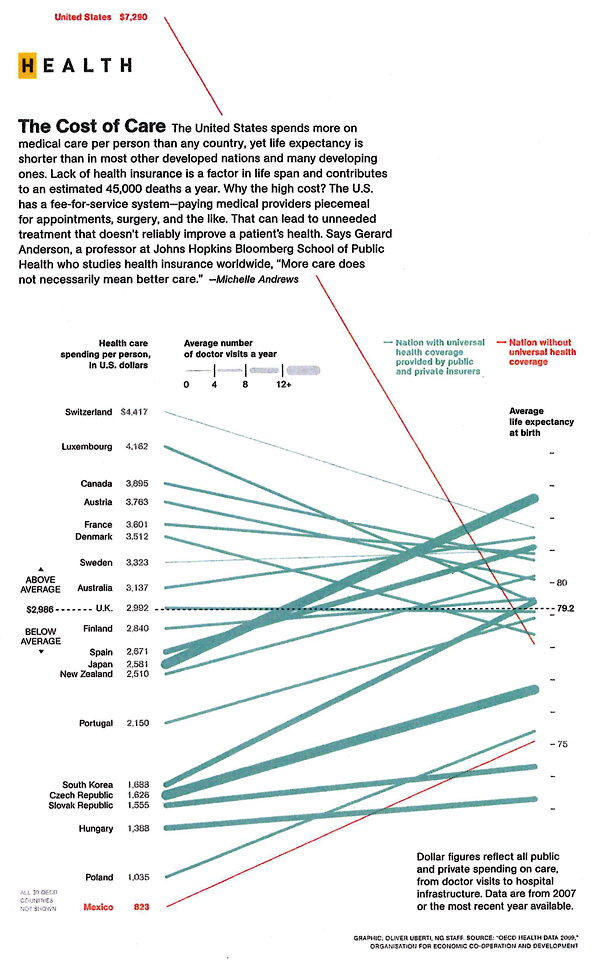
This graphic is doing a lot of work compared to how simple it looks. Here’s an annotated list for review purposes:

  1. The colors of the lines show us which countries have universal health care (most of them) and which do not (the US, Mexico). Note that these colors do not differentiate between who, precisely, is paying for this health care – that’s complicated. In many nations the state pays for some people’s care or for some care for all people, but wealthier people or particular kinds of care are not covered by the state but are picked up by private insurers. It would get much more complicated if the graphic had to have a color for each – nearly every country would end up with its own color. Even in the US, the state pays for some of very poor people’s health care and for health care for those above 65 (though there are some limits on what the state’s willing to cover).
  2. The width of the lines show us how many trips people take to the doctor. The Japanese and people in the Czech Republic appear to see their doctor more often than I see my mom. Sorry, mom. However, even though people are always at the doctor in these places, their overall health care expenditures per person are not sky high. This could lead you to conclude that going to the doctor more often means that people are getting better preventative care. Preventative care is generally cheaper than ‘fix-it’ care. It could also lead you to conclude that people who are obsessed with their health are both more invested in taking care of themselves at home and more likely to run to the doctor at the sign of any little problem (On the one hand, if they are obsessed they will recognize any little problem sooner than those who are a bit more oblivious and it would seem that they might be less likely to try ‘quackery’, preferring to go to the doctor for the official treatment. No gingko biloba or St. John’s Wart from the Vitamin Shoppe unless the doctor says so.)
  3. The length of the line means nothing. These are not time lines.
  4. The slope of the line means…well…it implies that there ought to be a relationship between health care expenditures per person and average life expectancy. The implication goes like this: a country’s ranking in terms of per capita health care expenditures ought to match their ranking in life expectancy. Granted, I think anyone who has created this kind of graph before knows that the person who made it probably spent some time trying to come up with which measure of health would be the best one to use as the proxy for success – should it be life expectancy? Should it be some conglomerate variable that combines life expectancy, infant mortality, and something else? If you play this game with yourself, you probably end up just deciding that life expectancy is the cleanest comparison. But you may admit that it is imperfect. And it is. There are so many other things that get between health care expenditures and life expectancy. There’s environment, there’s the value of a given health care dollar which is not the same from one country to the next, there are cultural attitudes supporting relatively healthier and unhealthier lifestyles that vary from country to country, and so forth. This graph ignores those issues. It has to, but you don’t. Keep all that in mind, especially when thinking about how to allocate health care dollars. Maybe those Japanese people are on to something – they go to the doctor all the time, live long lives, and don’t spend inordinate amounts on health care. I know that if I had to stand on a scale in front of my doctor once a month or even once every 6 weeks I would think twice before eating things I shouldn’t eat or chickening out on my exercise regimen. There’s just something about getting an authority figure involved in processes like these to make us accountable for our own actions.
  5. The graph implies that there is a kind of sweet-spot for per capita spending that appears to fall between $2,000 and $4,000 [2007 dollars]. The US, of course, looks ridiculously over zealous when it comes to how much we spend and dismally stupid when it comes to where we put these dollars because we spend more on health care and get less in terms of life expectancy.
  6. Rankings to rankings comparisons

    I am not a fan of these rankings to rankings comparisons overall. Yes, this particular graphic packs a bunch of information in, but I still wonder how legitimate it is to compare national rankings in per capita expenditures on health care to national rankings in life expectancy. Forgive me for being an academic who *wants* the complex story. This is over-simplified. There is absolutely nothing in this graphic that would suggest what can be done about improving a nation’s average life expectancy whatsoever. Mexico seems to be doing OK – it spends relatively little compared to where it stands in the life expectancy rankings. So, clearly, if this graphic were all that we had to base decisions on, we might not decide that universal health care would give us a bump in life expectancy. If this were all we had, we’d probably just gut spending right away because the clearest point here is that the US is spending far too much compared to other countries in absolute terms as well as in relative terms when measured by life expectancy.

    The other thing the graphic does not show – something I’m always curious about – is how much of the money we spend on health care goes to administer the system both in the US and in other places. In our fair union, with all the insurance companies requiring different claims processes, we have to hire experts at the hospitals and clinics to submit claims and experts at the insurance companies to decide what to do about the claims. We hire other experts to negotiate the terms of groups plans in the first place – and where someone gets a special deal that requires a more complicated claims process. All of the complexity of health care meets the additional complexity of administering health care the way we’re doing it now and leaves space for lawsuits. So…lawyers sue various parties for a wide variety of reasons and doctors have to buy more malpractice insurance. The system increases the costs of keeping itself going without actually adding much of anything to the quality or quantity of patient care.

    Reference

    Uberti, Oliver. (2011) “The Cost of Care” [Information graphic] in National Geographic using OECD Health Data 2009 which draws on data gathered in 2007.

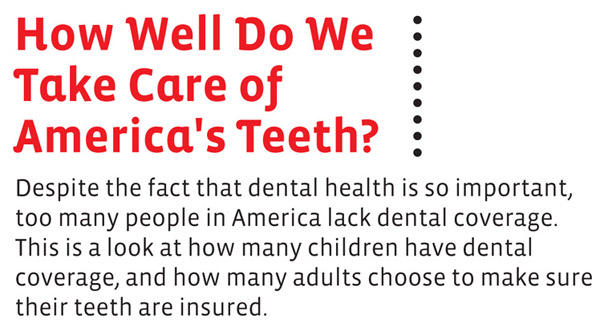
How Well Do We Take Care of America's Teeth?

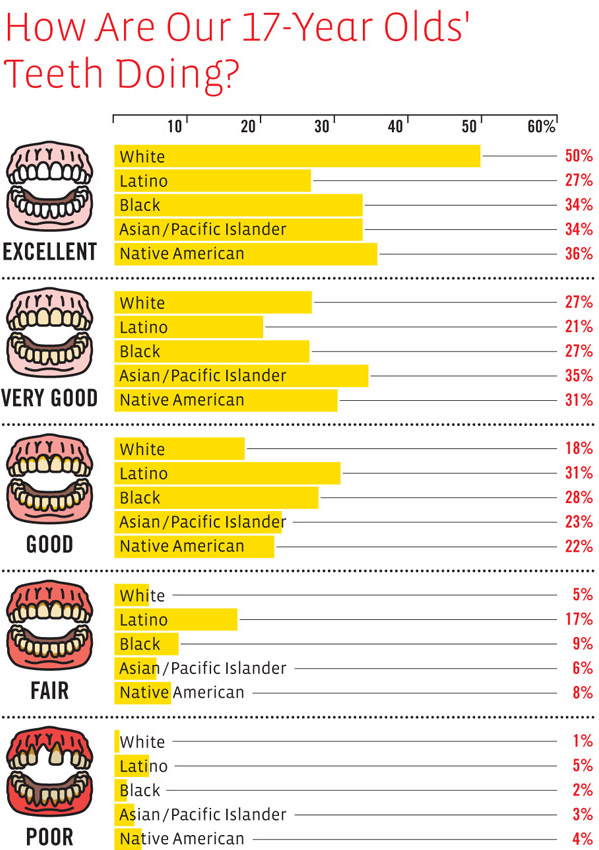
How Are Our 17 Year Olds' Teeth Doing?

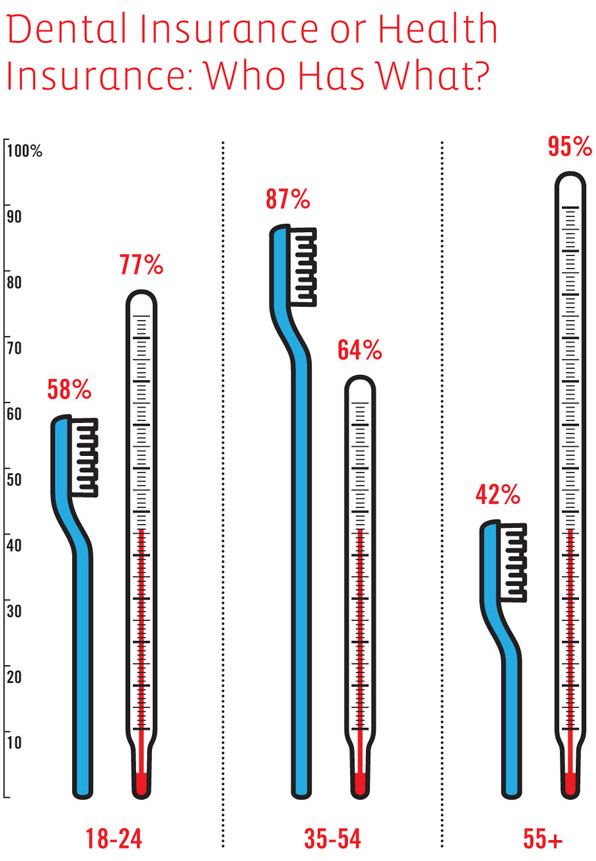
Dental Insurace or Health Insurance, Who Has What?

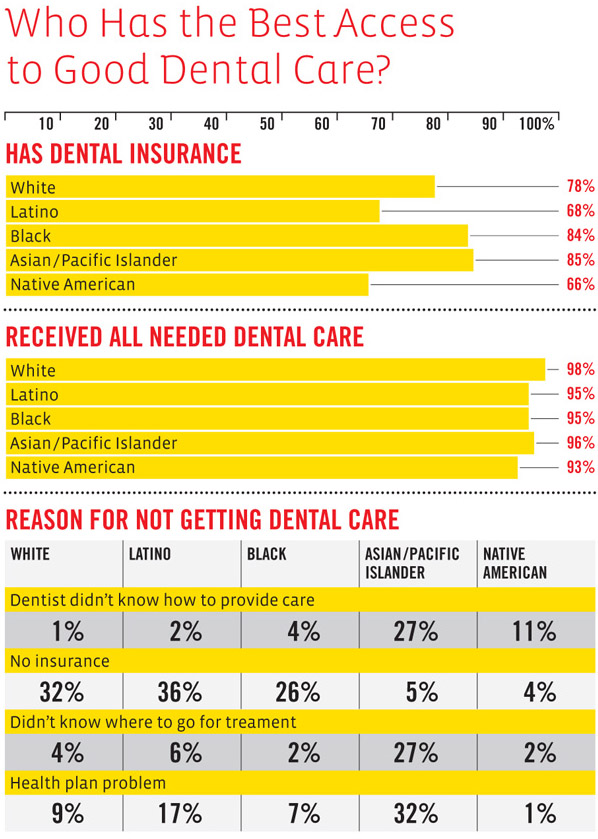
Who Has the Best Access to Dental Care?

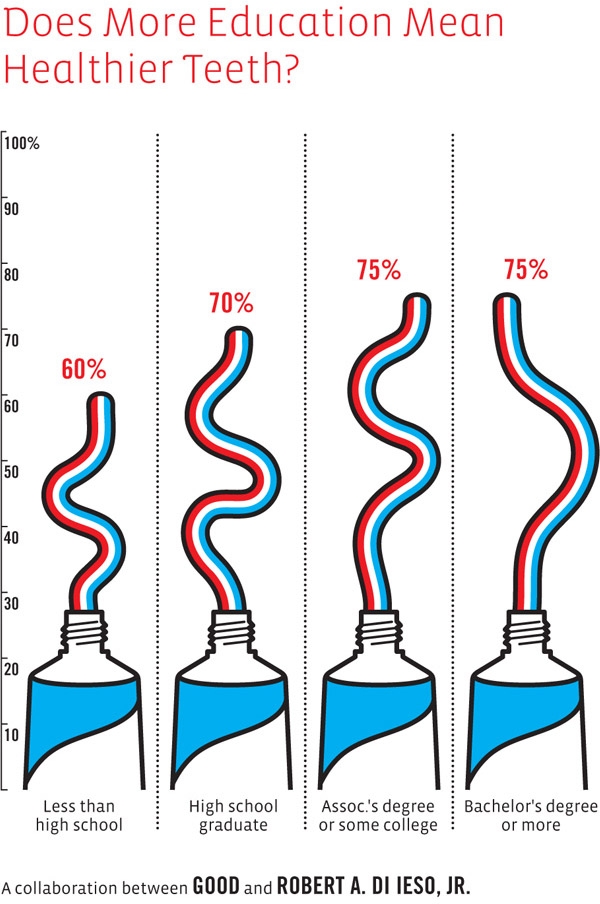
Does More Education Mean Healthier Teeth?

Happy Halloween

This graphic is a bit too cartoon-ish for my tastes but it does a good job of illustrating a health care gap that, even during the health care debate, went over-looked. I figured Halloween – a holiday whose commercialization revolves around candy – might be a good time to post the dental health care graphics developed over at the GOOD magazine transparency blog.

In the spirit of full disclosure: I was a dental assistant for a summer. The numbers here are accurate and have very real consequences. I used to see kids who did not know (they had no idea) that drinking soda was bad for their teeth. These kids sometimes had 7 and 8 cavities discovered in one check up. For older people, dry mouth would lead them to suck on lozenges or hard candy all day and they’d end up with a bunch of cavities, too. Bathing the mouth in sugar is bad. Combining the sugar with the etching acid in soda is even worse.

Once a tooth has a cavity, it needs to be filled or the bacteria causing the decay will continue to eat away at the tooth, eventually hitting the pulp in the middle of the tooth. Once that happens, the person is usually in pain and needs a root canal. Even if they aren’t in pain, they need to have the infected tissue removed (that’s what a root canal treatment does) or the infection can spread, sometimes into the jaw bone. There is no way for the body to fight an infection in a tooth because the blood supply is just too little to use the standard immune responses.

Dental decay progresses slowly. Kids lose their primary teeth any decay in those teeth goes with them. Therefore, it’s not all that common to see teenagers needing root canals. But it does happen. Root canals are expensive. It’s a lengthy procedure requiring multiple visits and a crown. Pricey stuff. BUT, this process allows the tooth to be saved. Without dental insurance, sometimes folks opt for the cheaper extraction option. Once a tooth is extracted, that’s it. It’s gone. (Yes, there is an option to have a dental implant but that’s even more expensive.) So a teenager who likes to suck on soda all day long and who may not be all that convinced about the benefits of flossing could end up losing teeth at a young age. I can tell you because I’ve seen it: a mouth without teeth is not a happy mouth. All those teeth tend to hold each other in place. Once some of them are extracted, the others can start to migrate. Extract some more and things get more interesting and people start to build diets around soft foods. Eventually, once enough of them are extracted the entire shape of the mouth flattens out – not even a denture can hang on to help the person eat.

Unfortunately, poor dental health disproportionately impacts poor people, as these graphics demonstrate. But that disproportionate impact can double down. Dental health is often seen as a sign of class status. People with poor dental health have trouble getting good jobs, especially in a service economy. For what it’s worth, I bet they also have more trouble in the dating/marriage market.

References

Di Ieso, Robert. (2 September 2010) How well do we take care of America’s Teeth? [Centers for Disease Control; Pediatrics]

Xanax Nation | GOOD Mag. Transparency Blog

What works

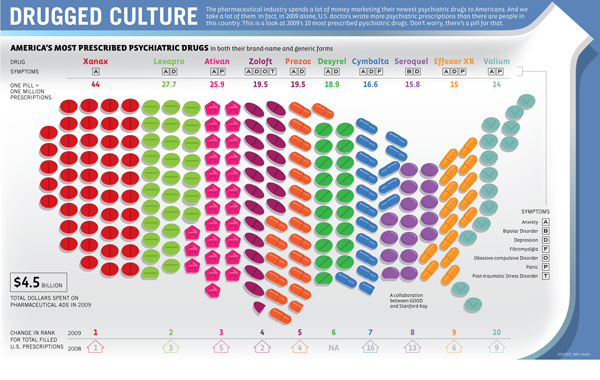
Um, so, I’m trying to think of what is working here. I guess we see that there are about 10 psychiatric drugs, that lots of people appear to be receiving treatment for anxiety (heck, two wars, an economic crisis, trapped Chilean miners, BP’s oil spill…all this anxiety makes sense to me). We are meant to believe that this represents a huge and possibly stifling example of big pharma. But really, this graphic doesn’t say that to me. It says “lots of people are anxious and choosing to take prescription drugs to cope”.

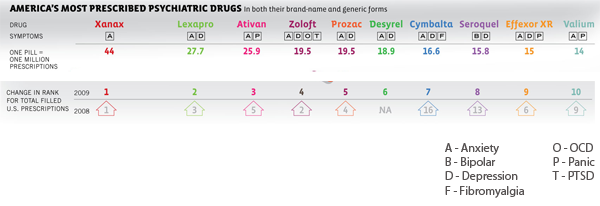
Xanax Nation without the map

What needs work

Just for some crazy antic fun, infographic style, I whipped out my digital crop tool and got rid of the map just to see what we would lose. Clearly, we lose some fun. Almost all the pretty colors are gone. But the information? It’s all still there. The map was being used as a giant and rather useless crutch in this case. This is a particularly egregious case, but there are many instances of maps that don’t encode any information that is useful for the debate of the topic at hand. Ask yourself: what did the map do? Was there any variation contained in the map? Was the dataset in question geographically oriented in any way? No. No, it was not.

Thanks to Austin Haney, Sociology grad student at Kent State for sending this our way.

References

Drugged Culture GOOD magazine, Transparency Blog.

(2010) One Nation Under Xanax in Psychiatric Times.

Getting drugs to market faster, timeline graphic | Wired Magazine May 2010
Getting drugs to market faster | Wired Magazine May 2010

What works

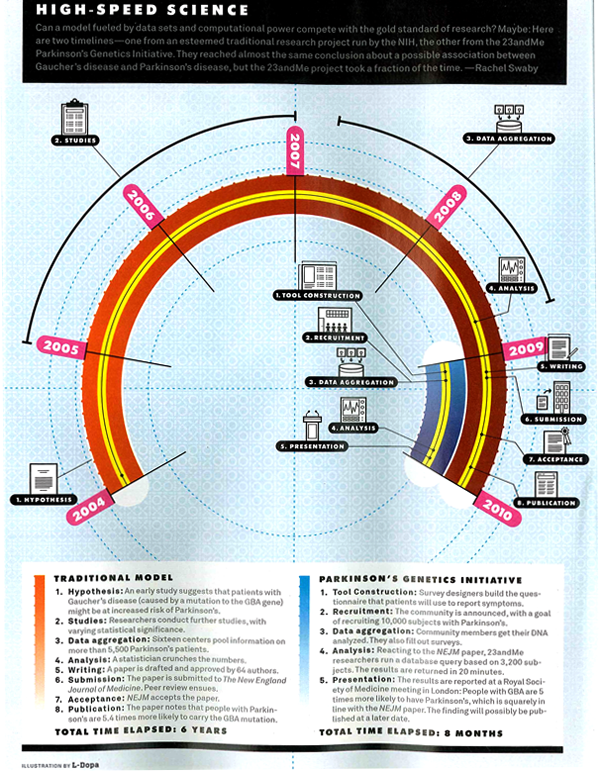
I am not a huge fan of this graphic though I admit it works better in print than it does in this crappy scan of the print article. My apologies. Click through here for a crisp version.

In summary, the article is about the way that research is done in the presence of many more data points (specifically, complete DNA maps of numerous individuals) and much more processing capacity. They argue using a case study revolving around the personal story of Sergey Brin who is at risk of developing the as-yet-untreatable Parkison’s disease, that data mining means research will progress much faster with no loss of accuracy over traditional research methods. They use a medical research case so they get to conclude that moving to data mining will mean people who might have died waiting around for some peer review committee (or other tedious component of double-blind research methodology) will live. Hallelujah for data mining!

They summarize their happiness in this Punky Brewster of a timeline.

What needs work

First, why did the art director order a timeline and not a diagram about how the assumptions underlying the research method have changed? It is clear that the article is taking a stand that the new research methods are better because they are faster and, in the case of Parkinson’s, could save lives by speeding things up. That is undoubtedly true, as it would be for any disease for which we currently don’t have anything that could be referred to as a “cure”. However, as a skeptical sort of reader, I find it difficult to simply believe that the new data-mining variety research is always going to come up with such a similar result – “people with Parkinson’s are 5.4 times more likely to carry the GBA mutation” (hypothesis driven method) vs. “people with Parkinson’s are 5 times more likely to carry the GBA mutation” (data-mining method). If the article is about research methods, which is ostensibly what it claims. However, featuring the chosen cause of e-world celebrity Sergey Brin could indicate that Wired doesn’t so much care about changing research methods as it cares about selling magazines via celeb power. Fair enough. It’s kind of like when Newsweek runs a cover story about AIDS in Africa accompanied by a picture of Angelina Jolie cradling a thin African child. Are we talking about the issue or the celebrity? In this particular article, it seems to me that if the core message were to focus appropriately on the method, the graphic could have depicted all of the costs and benefits of each research model. The traditional model is slower but it makes more conservative assumptions and subjects all findings to a great deal of peer review which offers fairly robust protection against fallacies of type 1 and type 2 (ie it protects us from rejecting a true hypothesis as false and accepting a false hypothesis as true). In the data mining scenario, since the process begins not with a hypothesis but with the design of a tool, there are reasons to believe that we may be more likely to run into trouble by designing tools that too narrowly define the problem. A graphic describing just how these tools are constructed and where the analogous checks and balances come in – where are the peer reviewers? What is the hypothesis? How do data-miners, who start by developing tools to extract data rather than hypotheses in line with the current literature, make sure they aren’t prematurely narrowing their vision so much that they only end up collecting context-free data (which is basically useless in my opinion)?

Don’t get me wrong, I am excited by the vast quantities of data that are both available and easy to analyze on desk top computers (even more can be done on big work stations and so forth). Caution is in order lest we throw out all that is reliable and robust about current research methods in favor of getting to a result more quickly. We could use the traditional hypothesis driven, double-blind kind of trial procedure coupled with the power of DNA analysis and greater processing capacity. It’s somewhat unclear why we would abandon the elements of the traditional scientific method that have served us well. There is a way to integrate the advances in technology to smooth over some of our stumbling blocks from the past without reinventing the wheel.

Concerns about the graphic

My second major problem is that this graphic is one of a type commonly referred to as a ‘time line’. In this case, what we appear to have is a time line warped by a psychedelic drug. This might, in fact, be appropriate give that the article is about neurology and neuropathy. Yet, the darn thing is much harder to read in the Rainbow Brite configuration than it would be if it were, well, a line. Time. Line. And the loop back factor implies that there is going to be a repetition of the research cycle starting with the same question (or dataset) all over again. That’s sort of true – the research cycle has a repetitive quality – but it is not strictly true because hopefully the researchers will have learned enough not to ask the exact same question, following the exact same path all over again.

References

Goetz, Thomas. (July 2010) Sergey’s Story Wired Magazine.

Wired magazine. (12 March 2009) Science as Search: Sergey Brin to Fund Parkinson’s Study on the Wired Science blog.

23andme (11 March 2009) A New Approach to Research: The 23andMe Parkinson’s Disease Initiative. [This was an early announcement about this project from 23andme who offered the DNA analysis].

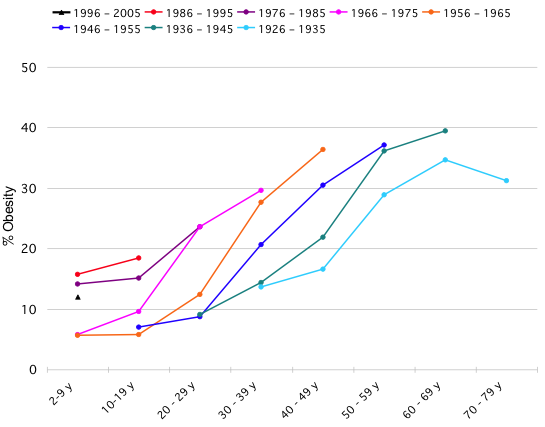
The graph below was originally posted at Flowing Data with an invitation for readers to take the same information and display it with clarity and meaning. The image below is difficult to understand – it brings to mind one of my favorite tricks which is to see if the infographic would deliver more or less the same message if it were in gray scale. This one would suffer in gray scale even more than it already is, a bad sign.

The original chart showing the increase in obesity (confusing)

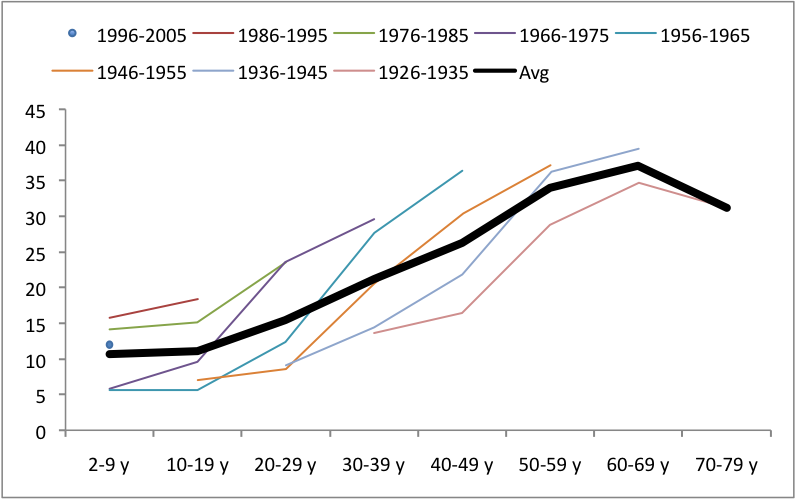
Jonas Sekamane took up the challenge posed by Flowing Data and came up with what you see below as a first stab. He said, “My main “beef” with the graph above, is that comparison is difficult, if not impossible. This is of course due to the data gaps, but it could easily be fix with a guideline of some sort. Adding an age-group average, makes it much easier for the viewer to see if the level of obesity is in fact high or low.”

The second draft - now there is a single trend line, but still confusing

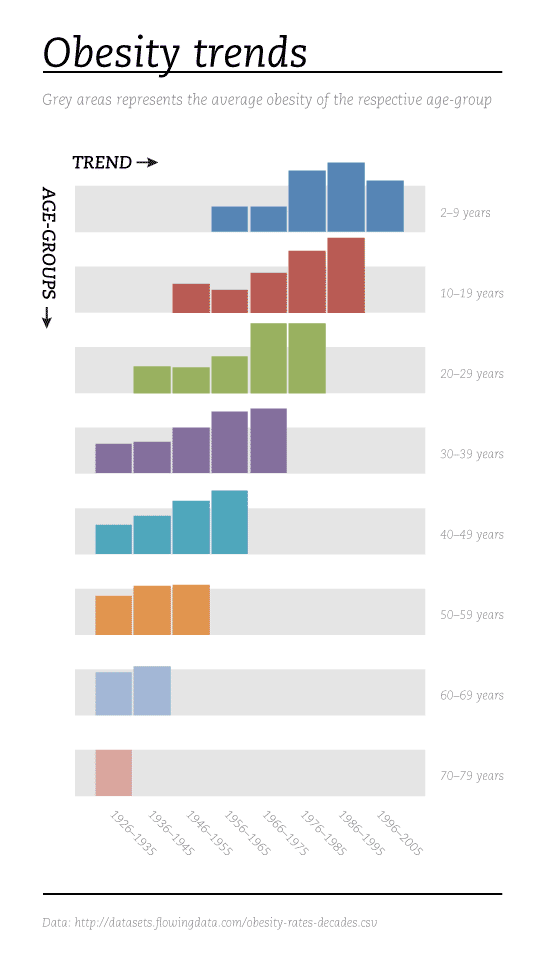
But he didn’t rest on his relatively simple fix. He decided that starting over altogether would be the only way to wrestle this information into a clear, meaningful infographic. First, he massaged the data into a more visually relevant format by calculating, “an index in Excel where 100 = the age-group average.”

I agree with his assessment of the original – that it was too far gone to be saved. I’d also like to take this opportunity to address social scientists more accustomed to the writing process than to graphic design process. Just as a paper will require several drafts before it reaches it’s potential, most graphics get better with revision. And like this reworking proves, sometimes it is necessary to scrap it all and start over, even after you think you have something could work. The key is that you cannot fall in love with your graphic designs (or your papers). In order to maximize their potential, some of them will need demolition and redesign, not just a new coat of paint.

No more trend line - Easy to see that obesity is increasing, especially for young people

Reference

Sekamane, Jonas. (29 April 2010) “Obesity Trends – Makeover”

Flowing Data (29 April 2010) Challenge – Graphing Obesity Trends

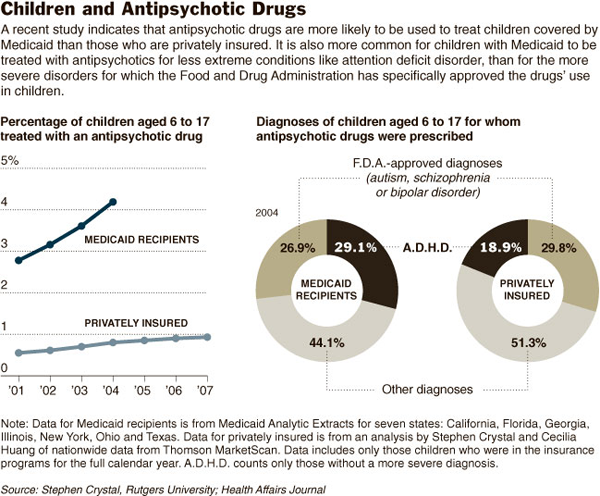
Antipsychotic drugs for kids with private insurance vs. Medicaid - New York Times

What needs work

Forget the line graph for now and look at the donut chart. Pie charts are hard enough to read, I think donut charts are even harder. I would prefer that the donut get stretched out like in the literacy in the US graphic from last week. It’s easier to compare the length of a line segment than the length of a curve.

There is an obscurantist move going on with the use of percentages here. What we need to contextualize the data shown is the percentages of children on Medicaid and with private insurance who seek mental health diagnoses in the first place. Maybe the privately insured are self-selecting more intervention, even where it’s unwarranted, because their kids might be in schools that are more sensitive to classroom disruptions or for some other reason. In that case, a more sensitive trigger that sends these privately insured kids to the doctor in the first place would render the finding that fewer of them have serious problems not nearly so alarming as the article makes it out to be. The article implies that as a society, we are stigmatizing poor children as mentally unhealthy and prescribing them drugs with serious side effects. If that is what is happening, it is truly uncool. But I don’t feel like we can come to that conclusion based on this graphic. Not enough contextual information.

Furthermore, the slush category is just too big. Over half of the privately insured children are receiving “other diagnoses” and 44% of the kids on Medicaid find themselves in this category as well. I really don’t know how to fit that into the argument that Medicaid recipients are receiving drugs for lesser disorders than privately insured children. The category is so large and so ill-defined that it offers no contextualization for the diagnoses that the article is most interested in – namely, ADHD and autism+schizophrenia+bipolar disorder. Maybe the kids in the slush category are receiving essentially the same sort of diagnosis except that prescription drugs are not involved. We have no idea what is going on in this category and it is too big to write off.

The article points out that prescribing drugs for the treatment of psychotic disorders in children should be done quite carefully because the drugs carry many side effects. I think that the narrative of the article could have been strengthened by a graphic that fixed the above-mentioned problems as well as describing the more qualitative outcomes of the drugs. Show me a graphic of what happens to a kid who is properly diagnosed and takes the drugs (weight gain, etc) vs. a kid who should have been diagnosed and treated with drugs but wasn’t (more suspensions, etc.) vs. a kid who received non-drug treatment for a correct diagnosis vs. a kid who received drugs but had only a sub-clinical problem that shouldn’t have been medicated. And for the economists, throw in the economic cost of these various treatment options.

References

Wilson, Duff. (2009, 13 December) Poor Children Likelier to Get Antipsychotics New York Times, Health Section.

Where does my money go? in the UK - Open Knowledge Foundation, raphic by Iconomical

What works

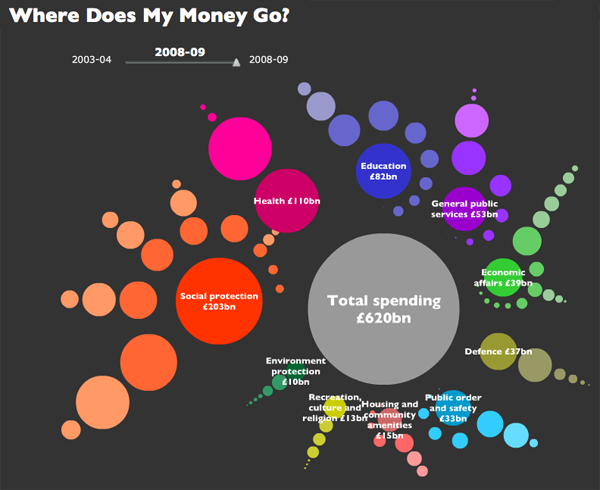
This visually arresting graphic does a great job of presenting data about national spending in an apolitical but altogether fascinating way. It’s interactive, by the way, but I’m not commenting on the interactive part, just the static graphic. I find that getting the static graphic clear is an important first step towards making a functional interactive graphic. If ever I hear someone say ‘but it’s interactive’ as an excuse for having a weak static graphic, I cringe. See my post about the USDA mypyramid food guide for a case study on the importance of a strong relationship between the static and interactive iterations of graphics as tools.

Each dot represents a different department or governmental program with the size corresponding to the funding level. Smart.

If you link through to the originating site, you’ll be able to follow blog posts that take readers through the development of the graphic. They ask for input and do their best to incorporate it. I like that approach. Good use of technology, OKF.

What needs work

I can’t quite tell why the circles are arranged the way they are or why their hues are the shades they are. Graphics, especially the beautiful ones, are the best when their simple clarity gives way to an elegant complexity. In other words, when I pose the question: “why does the hue vary within given funding types?” I’d like the graphic to lead me to an answer. I’m sure there is a reason for each hue, I just haven’t been able to figure it out.

One tiny, American-centric request: Add ‘UK’ to the page or the graphic somewhere. Maybe change “Total spending” to “Total UK spending”. Or “Where does my money go?” could be “Where do UK taxes go?”. These here interwebs are global. Yes, of course, the £ symbol tends to give it away. Maybe I’m just being too picky.

References

Open Knowledge Foundation. (2009) “Where does my money go?” United Kingdom. Data available

Drug related deaths increase - Associated Press article based on CDC data

What works

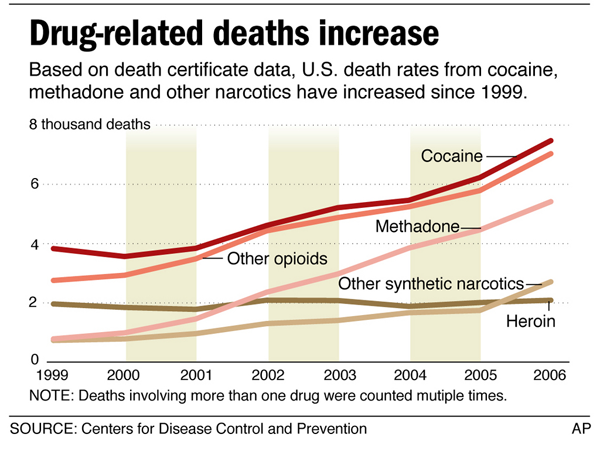
A simple line graph shows that more people are dying from methadone than heroin and the difference is growing over time. It also shows that cocaine is more dangerous than anything other drugs on the graph, at least when it comes to fatalities. Note that these data represent deaths due to acute overdoses as well as fatalities due to complications from long term use.

What needs work

I have no idea what the bars behind the line graphs represent. They seem to be there just to be graphic – I am not in favor of the use of meaningless graphic dross. The article that accompanied this graph mentions that 39,000 people die every year due to drugs and 45,000 die in traffic accidents (though auto-deaths are dropping and were at ~37,000 in 2008 according to Fatality Analysis Reporting System). This means that in some states – mostly in New England and the Mid-Atlantic – more people are dying from drugs than cars. This is big in America where traffic fatalities have long been an unfortunate fact of life. Safety standards have been improving so traffic deaths have fallen. I would have liked to see the traffic deaths applied to this graphic. It would have been more meaningful in the context of the article than the random bars behind the lines.

Where are alcohol related deaths?

The labels go from the very specific “Methodone” to the incredibly vague “other synthetic narcotics” and “other opioids”. The article says that the growth in drug-related fatalities is coming from prescription drugs like Oxycontin, Vicodin, and Methadone. OxyContin and Vicodin contain hydrocodone which places them in the “other opioids” category but it seems like it would also place them in the “other synthetic narcotics” category.

There are plenty of people who will not read the whole article. The graphic needs to speak for itself with clarity, complexity, and completeness otherwise it risks oversimplification and obfuscation.

Bonus graph

Oxycodone in grams distributed per 100,000 Population, Arizona and US, 1997-2006

The Proceedings of the Community Epidemiology Work Group, January 2009 included a presentation by James Cunningham that featured this data about the increase of oxycodone across the US population. I think this graph helps contextualize the oddly stylized line graph that is the central focus of this post. Here you can see that there is simply much more hydrocodone around than there used to be. The original article by the AP attributes this to the recognition of the treatment of chronic pain as a new and challenging medical field. In that case, then, it should be no surprise that Arizona is a hotbed for hydrocodone prescriptions because the state’s demographic is over-represented by the elderly who are more likely to need pain management strategies.

Final question

I don’t usually get political, and I’ll probably regret posing this question, but here goes.

Do drug companies bear any responsibility for the fatalities involving prescription drugs? Clearly it is in their financial interest to sell an addictive product – and nobody denies that opioids are addictive. Big tobacco ended up having to pay out millions, but that’s because in the beginning, they denied that their products were so unhealthy that using them was potentially fatal. Opioid producers are not making claims one way or the other on the question of fatality beyond admission that the substances are addictive and should be monitored by doctors. This shifts the blame to doctors, but it is often the case that addicted patients will seek these drugs from all sorts of different doctors making it difficult for any given doctor to know just what the patient was prescribed by some other health care professional. It is important to note that opioids offer meaningful treatment for chronic pain where tobacco products did not play a legitimate roll in mainstream medicine and thus should not be banned or taxed, etc.

This brings us back to the original question: should big pharma take some responsibility for deaths due to use/abuse of the prescription drugs from which they derive profit?

References

Associated Press. (2009, September 30) In 16 states, drug deaths overtake traffic fatalities at cleveland.com

A bigger version of the graphic is here: Drug-related deaths increase

Hydrocodone fast facts from drug-addiction.com

Community Epidemiology Working Group. (2009, January) Epidemiologic Trends in Drug Abuse: Proceedings of the Community Epidemiology Working Group | Highlights and Executive Summary [PDF] US Department of Health and Human Services, National Institutes of Health.

Infant mortality gap between blacks and whites in Wisconsin

What works

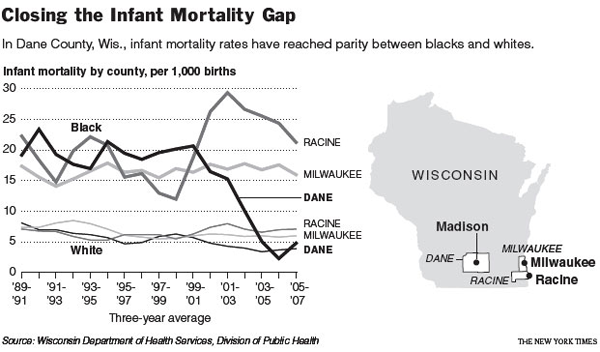
I like the inset map. Architects often include a small site map in the main exterior section of a new building to help the viewer understand where the building is in relation to the rest of the world. News programs often start out international stories with maps. I love that this line graph comes with an orienting map. I might have included just a shadow of some neighboring states simply because many Americans have only a fuzzy idea of where Wisconsin is. Sad but true.

The lines show a great deal of information, some of which is not addressed in the article. Quoting the main thrust of the article:
“Here in Dane County, Wis., which includes Madison, the implausible has happened: the rate of infant deaths among blacks plummeted between the 1990s and the current decade, from an average of 19 deaths per thousand births to, in recent years, fewer than 5. The steep decline, reaching parity with whites, is particularly intriguing, experts say, because obstetrical services for low-income women in the county have not changed that much.”

Then it goes on to quote a local doctor and professor: ““This kind of dramatic elimination of the black-white gap in a short period has never been seen,” Dr. Philip M. Farrell, professor of pediatrics and former dean of the University of Wisconsin School of Medicine and Public Health, said of the progress in Dane County. “We don’t have a medical model to explain it,” Dr. Farrell added, explaining that no significant changes had occurred in the extent of prenatal care or in medical technology.”

The graph suggests an explanation that the article (and the doctor) may not have considered. Presenting information visually is about more than presentation; rearranging data to reveal patterns is a research tool in itself.

What needs work

This is a critique of the article, based on the line graph: isn’t it possible that the at-risk folks in Dane County ended up moving to Racine for some reason? Right at the time the infant mortality rate in Dane was plummeting, the rate in Racine was spiking. From the line graph it seems that this happened in the vicinity of Clinton era welfare reform. Maybe there were some reasons for the most at-risk folks to get out of Dane and into Racine at this time.

If there is no medical explanation, let’s have a look at other possible explanations.

References

Eckholm, Eric. (2009, November 26) Trying to Explain a Drop in Infant Mortality The New York Times US Section, reporting from Madison, WI.