
Overview
On Tuesday I read “When One Farm Subsidy Ends, Another May Rise to Replace it” OR “Farmers Facing Loss of Subsidy May Get New One” by William Neuman [aside: why does the NY Times frequently have two titles for the same article? One appears in the title tags in the html and in the URL, the other appears at the top of the article as it is read]. The upshot of the article is that the subsidies appear to be curtailed as cost-saving measures but come right back under new names:
It seems a rare act of civic sacrifice: in the name of deficit reduction, lawmakers from both parties are calling for the end of a longstanding agricultural subsidy that puts about $5 billion a year in the pockets of their farmer constituents. Even major farm groups are accepting the move, saying that with farmers poised to reap bumper profits, they must do their part.
But in the same breath, the lawmakers and their farm lobby allies are seeking to send most of that money — under a new name — straight back to the same farmers, with most of the benefits going to large farms that grow commodity crops like corn, soybeans, wheat and cotton. In essence, lawmakers would replace one subsidy with a new one.
Neuman also interviewed Vincent H. Smith, a professor of farm economics at Montana State University who, “called the maneuver a bait and switch” saying,
“There’s a persistent story that farming is on the edge of catastrophe in America and that’s why they need safety nets that other people don’t get. And the reality is that it’s really a very healthy industry.”
My curiousity was piqued, to say the least. Farm subsidies have long been an emotionally charged issue – Professor Smith is right to point out that the family farmer is an icon in the American zeitgeist whose ideal type gets trotted out as a narrative to support subsidies that often go to large-scale corporate agriculture. Before mounting my own angry response to what appears to be both hypocritical and a well-orchestrated marketing schmooze (ie the public proclamation by various farm lobbies that they are willing to take fewer subsidies as they band with the rest of the beleaguered American public in a collective belt-tightening process while simultaneously opening up other routes to receive the same amount of funding through different mechanisms), I decided to go in search of some hard data to see what is going on with agricultural subsidies.
Agricultural data
I found two great sources of data. First, the USDA runs the National Agricultural Statistics Service which publishes copious amounts of tables full of information about how much farmland there is in the US, what is grown on it, what the yields are, what commodity prices are, what farm expenditures are doing, and all sorts of rich information. Linked from the article was another source of data – the Environmental Working Group – which has been tracking farm subsidies for years. The Environmental Working Group also relies on the National Agricultural Statistics Service, especially for farm subsidy information. Between those two sources, the US Census, and the 2012 US Statistical Abstracts (Table 825 especially), I had more than enough information to start putting together a graphic that could describe at least part of what is going on with agricultural subsidies.
Selecting the right data
Because farming is distributed unevenly around the country, I knew I needed to come up with a set of numbers that went beyond absolute dollar amounts per state. Probably it would have been nice to see where subsidies go per crop, but other people have already done that.
To look at agricultural subsidies overall, and to work with the state-by-state data that I had, I ended up considering three approaches.
- 1. Absolute commodity subsidy amounts per state.
- 2. Commodity subsidy amounts per capita.
- 3. Commodity subsidy amounts per farmland acre.
It is obvious that the third option, looking at the amount of spending per acre within each state, is the best.
Hypothesis
I expected to find that states with small amounts of farmland would be relatively more expensive per acre than states with large amounts of farmland. I assumed there would be economies of scale and that states with very large amounts of farmland probably had a lot of that land dedicated to pasture, which is pretty cheap to maintain compared to something like an orchard.
Attempt Number 1
I decided that simply showing the costs per acre might not be as interesting as keeping the absolute amount of farmland in play and doing some kind of comparison.
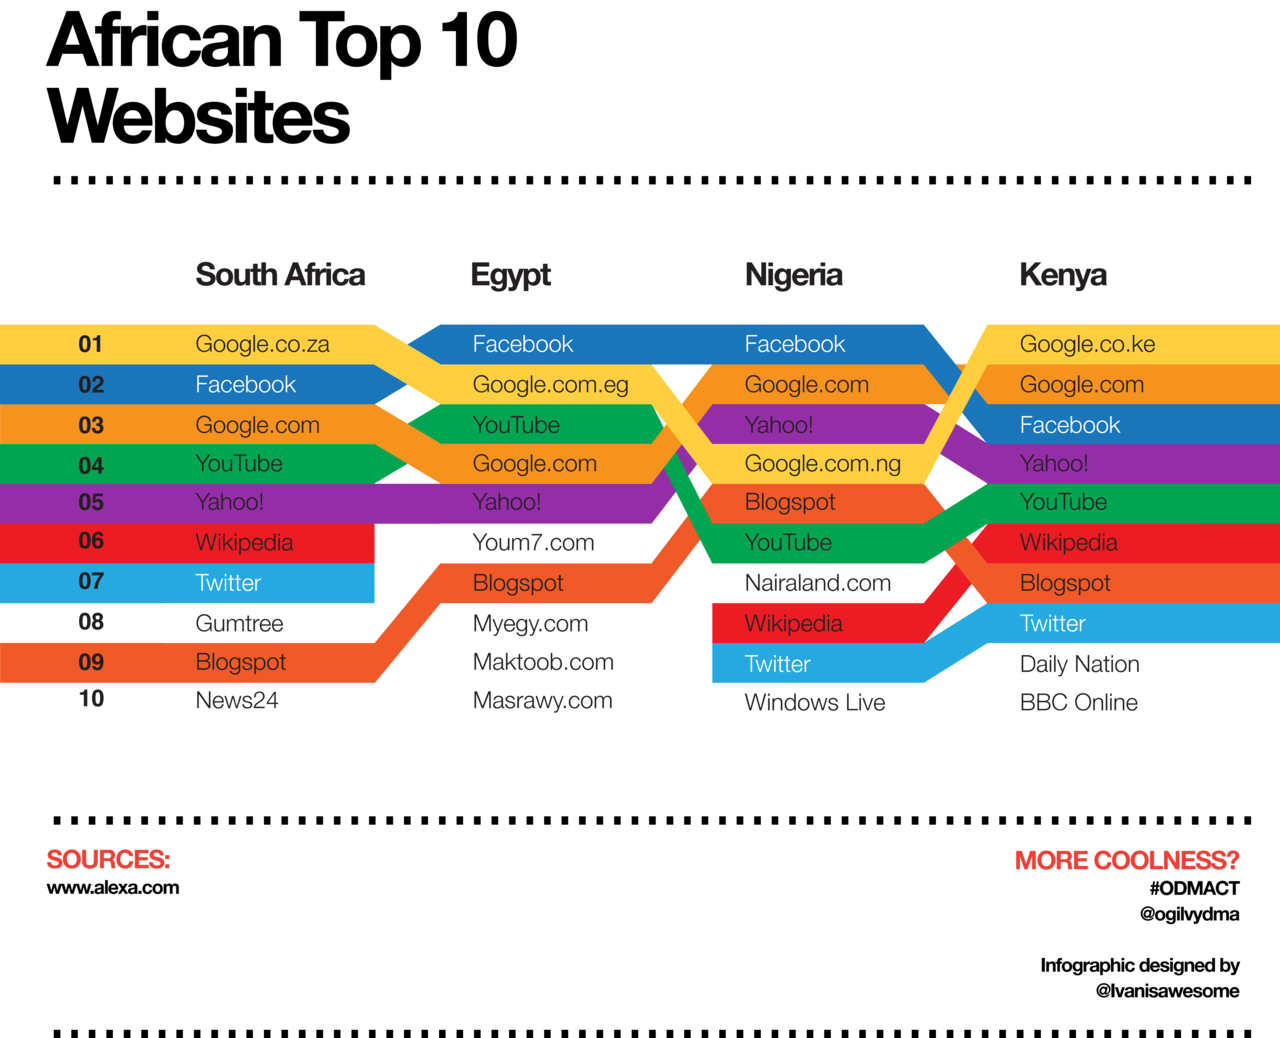
Rank comparisons are extremely popular and I admit I was sucked into them, though now that I’ve tried to make them, I kind of hate them. These are the kinds of comparisons that you’ll hear on the news – Ohio ranks Yth in per capita income but Zth in educational spending per pupil – and see in graphics that often look like this:
My first attempt to do something similar looked like this.
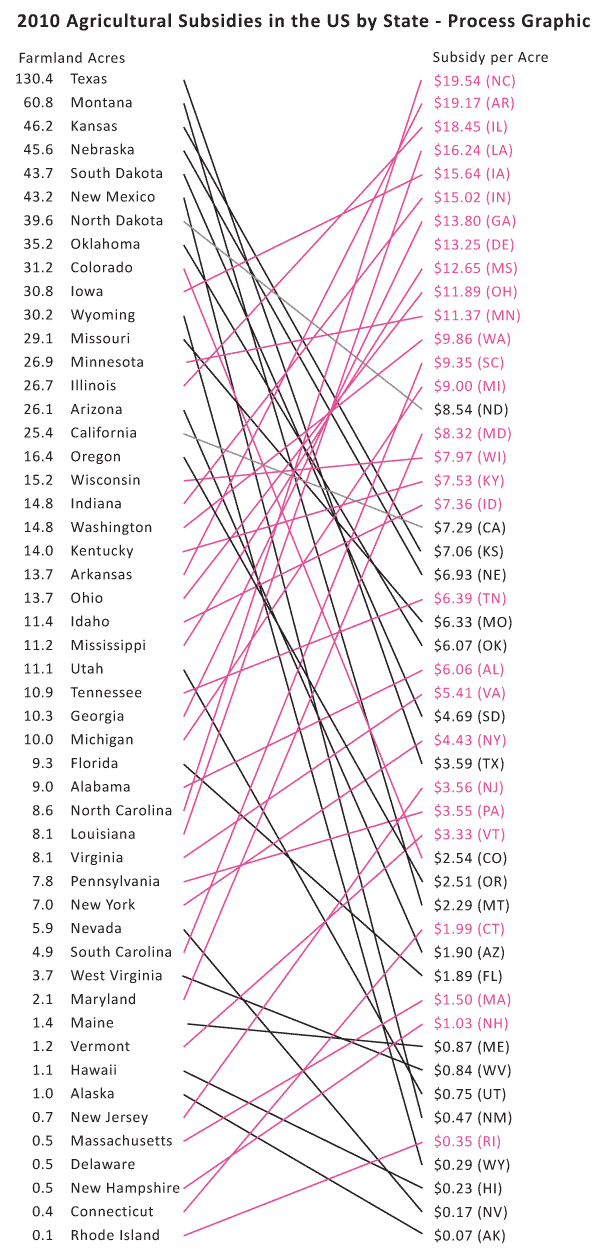
Here are my problems with it:
- There is no obvious pattern – it looks like a rat’s nest.
- The states with bad ratios – the ones where we are paying more than $10/acre – have upward sloping lines connecting them from the left column to the right column. Psychologically, the ‘bad’ deals should have downward sloping lines. It just makes better visual sense.
- Pink was supposed to be along the lines of red on accounting sheets but it looked too cheery to indicate being ‘in the red’.
Attempt Number 2
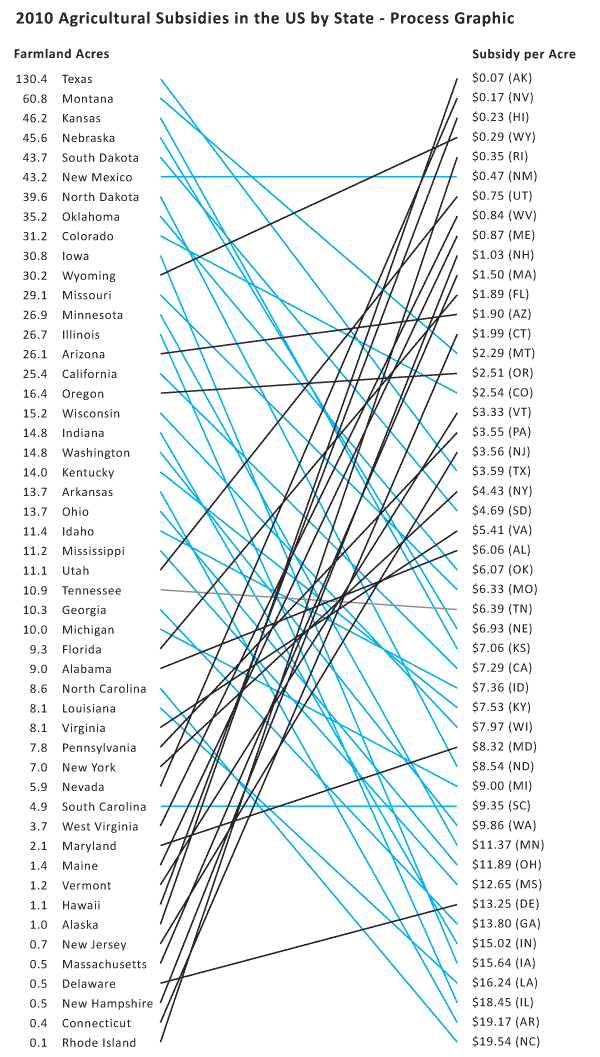
I got rid of the pink altogether and flipped the scale on the left so that the best deals – the lowest per acre subsidy costs – are at the top. This means that states that are taking less per acre end up having upward sloping lines more often than downward sloping lines.
Thinking through this brought up some larger concerns. Comparing by rank alone is ridiculous. The space between each listing in both columns is extremely critical in a graphic like this and needs to be scaled appropriately. For instance, look at Alabama ($6.06) and Oklahoma ($6.07) in the right hand column. They basically have the exact same amount of spending per acre and yet they are the same distance apart as Washington ($9.86) and Minnesota ($11.37). The same problem happens in the lefthand column – states with about the same amount of acreage dedicated to farmland have the same distance between them as states with large differences in the amount of acreage they have dedicated to farmland.
Attempt 3
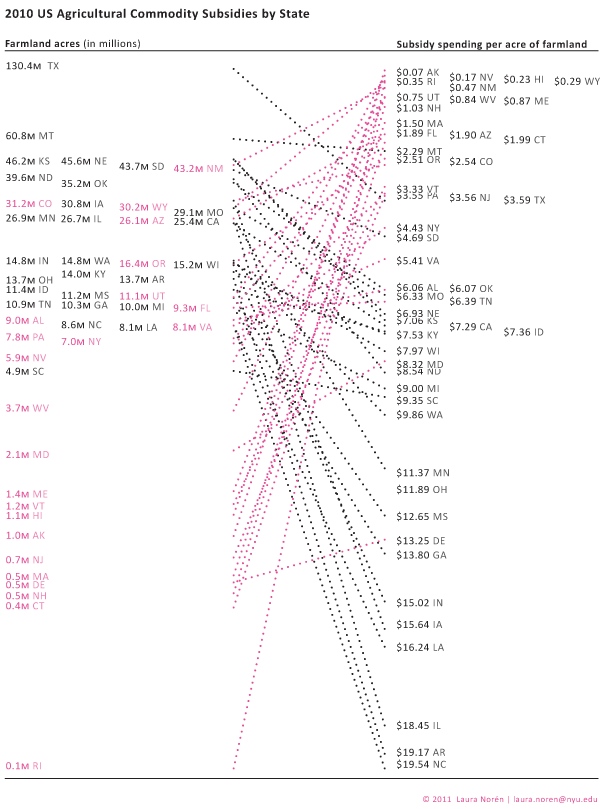
Click here to see a pdf of the whole graphic.
I scaled both the right and left hand columns using a log scale for farmland acreage (though the number of acres is still given in absolute millions of acres – only the visual arrangement was logged). The pattern is still messy and hard to discern, though clearer than in previous versions. In order to bolster the pattern, I turned the ‘good deals’ in the lefthand column pink. The states with less acreage dedicated to farmland routinely receive less subsidy per acre than some of the bigger states. But the very biggest farming states – like Montana and Texas – are also pretty affordable on a per acre basis. It was states near the middle of the pack that were coming in at $18 and $19 per acre of commodity subsidy spending.
I thought maybe it was a weather event that led to some of the larger subsidies. But if that were the case, states that were geographically near one another would probably have had the same drought/hurricane/flood and should have received similar funding. There is work to be done on the weather question – looking at data over time would be a good step in the right direction there.
However, I don’t know that weather is going to be the best answer to this question. Look at Washington and Oregon. They are geographically right next to each other, grow some similar kinds of things, and have a similar amount of farmland acreage yet they have dramatically different amounts of subsidy spending per acre. Washington takes $9.86 per acre; Oregon gets $2.51 per acre. It’s still unclear why there is such a great disparity between these two states in 2010.
Falsified hypothesis
Through the construction of this information graphic, I falsified my own hypothesis. The states with the smallest amount of land dedicated to farmland received the least amount of commodity subsidies.
I have some thoughts about what is going on. They will require more data analysis and graphic development to suss out and represent completely.
- New Hypotheses
- 1. It’s the weather. It could still be the weather. I did not do enough investigation into this variable, though this seems like a weak hypothesis.
- 2. It’s corn. The states that grow a lot of corn seem to get more subsidies. This hypothesis could easily be expanded to be something more sophisticated such as: “Subsidies per acre are sensitive to the commodity grown.”
- 3. It’s lobbying. The states that are known to be “big farm” states seem to have more funding than smaller farm states. Maybe they are better represented by the farm lobbies and therefore end up with more subsidy per acre than states without strong representation from the farm lobby. This hypothesis has an overlap with the “it’s corn” hypothesis.
Conclusion
There are two kinds of conclusions to be drawn. On the agricultural front, it is safe to conclude that Americans spend a good bit of money per acre of farmland; there is no free market on the farms. Bigger states do not offer economies of scale compared to states with less farmland acreage. No additional conclusions can be drawn from this limited data, though interesting hypotheses can be posed about the influence of local weather events, funding for specific commodities like corn, and the impact of lobbyists efforts on agricultural funding allocations.
As a graphic exercise, I hope I have proven that rank orderings do not offer much analytical value on their own. I hope I have also suggested that graphics can be used not only for representing findings at the end of the process but for discovering patterns. Graphics are not just for display, they are also for discovery.
References
Neuman, William. (2011, 17 October) “When One Farm Subsidy Ends, Another May Rise to Replace it” Business Section, nytimes.com.
Noren, Laura. (2011) US Agricultural Commodity Subsidies by State, 2010“US Agricultural Commodity Subsidies by State, 2010” [Information graphic] and [Data Table – this is a combination of data and analysis originally published by the National Agricultural Statistics Service, a public-facing branch of the USDA].
Environmental Working Group a good source for information on agricultural subsidy spending.
United States Census Bureau, Statistical Abstract of the United States (2011) Agriculture.
United States Department of Agriculture, National Agriculture Statistics Service
Comments 3
Joe — October 20, 2011
You draw the correct conclusions from your analysis. Thumbs up for that. However, you should have talked to a couple of farmers before you jumped into this issue. All your confusions would have been made clear.
First thing I noticed is that the size of the state overwhelms the area of farmland. Second thing is that not all dirt is equal. Farmers in Iowa get yields per acre that I'd need sorcery to achieve. Iowa, and other places beginning with "i", were agricultural zones first, and the subsidies came much later. Once you get cause and effect teased out of the tangle, your graphics might get easier to generate.
Umlud — November 1, 2011
One thing: Alaska is "AK" not "AS"