It’s the end of the term, what works about this image is that it requires very little analytical thought. Use those brain cells for writing papers (and grading them).
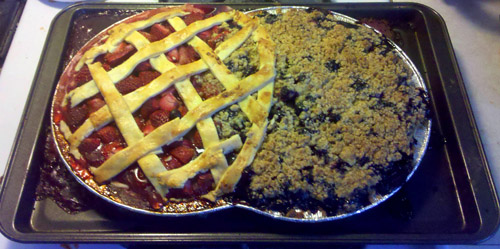
Pie chart humor | The shouting end of life via I love charts tumblr blog
What works
What can I say, I think it’s funny. Pie chart humor with real pie. Ha.
I am impressed at the time and effort someone put into trimming the pie plates, thinking through the crosshatching, and trying to get some different colors going on.
The text of the original post reads:
“THIS IS THE MOST IMPORTANT VISUAL PUN TO HAVE EVER BEEN POSTED ON THE INTERNET.”
I’d take that with a grain of salt, especially considering the gratuitous use of all caps. Probably it’s meant to be ironic or sarcastic or some other hipster attitude that I am too old to absorb osmotically.
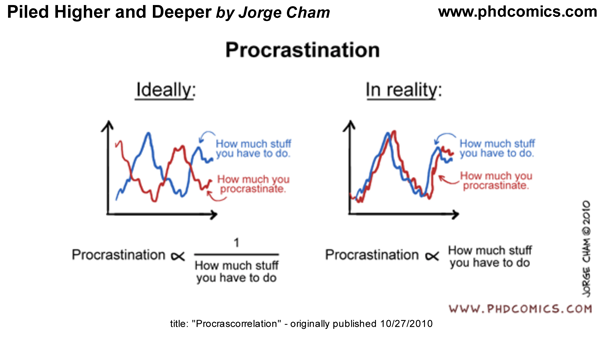
It’s finals season so this one seems appropriate. And I always like it when people tell jokes with graphs. Extra funny. Maybe only extra funny if you are a nerd.
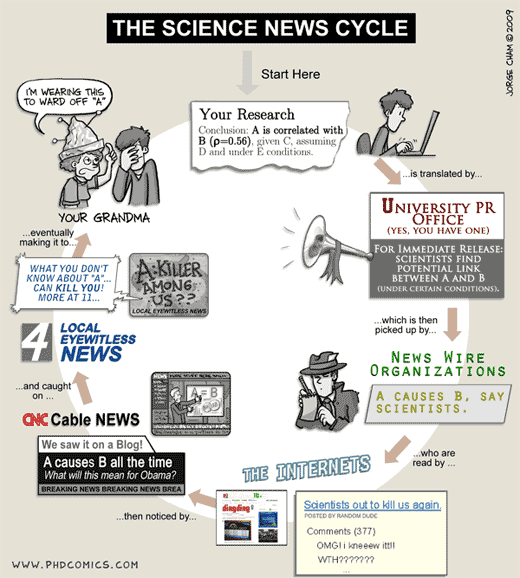
This could easily be applied to just about all research, not just bench science.
What needs work
Why is it that the media believe their consumers to be so daft? Where did the sound bite come from and what has it done to the production of news? To the practice of scientific research?
What is missing from this depiction of the research ‘cycle’ is that some researchers interpret the pressure to turn complex reality into a series of sensational sound bites as a sign that they should alter the way that they write up results in order to better fit the media’s model of dissemination. It’s hard to say this is always a bad thing – if it means that scientists actively seek a more active role in the dissemination of their work in order to pursue a real discourse, it can be a good thing. If it means that researchers promote their results in a skewed fashion, fail to fully disclose/discuss the conditions in which their findings will hold, or start choosing projects based on what will be more likely to make the news, then this science news cycle can be sincerely detrimental.
First Date vs. Reality TV First Date - by Nathan Yau from Flowing Data
What Works
I love jokes told via infographic.
What Needs Work
We need to tell more jokes via infographic and some of those jokes could be inside jokes that you wouldn’t immediately understand. When I come across an example of what I mean I’ll post it.
Landon W. Schurtz. PhD Candidate. University of Oklahoma – Department of Philosophy.
About Graphic Sociology
Analyzing the visual presentation of social data. Each post, Laura Norén takes a chart, table, interactive graphic or other display of sociologically relevant data and evaluates the success of the graphic. Read more…


