time line

Office email traffic

Editing process in graphic design

The editing process in graphic design is somewhat different than the editing process in writing. Writers tend to start with a skeleton, make sure the bones are all in the right places, and then slowly add and sculpt musculature and skin through iterative processes. Graphic designers start with a whole bunch of skeletons, subtract a few, add musculature to the rest, subtract a few of those, add skin to the remaining ones, and then only late in the process will a single design go through a final polishing process.

One of the ways social scientists teach students to become skeptical about the things they read is by teaching them how to edit their own work and the work of others. Students start to see how pieces of written work represent a series of choices. They see that what they’ve read could have gone in other conceptual directions, used different evidence, been shortened, lengthened, stripped of jargon, or otherwise constructed and styled in new ways that could have changed the meanings taken away by the readers. Learning to construct, critique, and polish writing is a major part of how readers develop the tools they need to understand and analyze the works they read.

There is far less educational time spent teaching students how to create visual work, especially visual work outside of the realm of personal expression (I feel like most arts programs emphasize personal expression which is different than creating visual work with the intent of displaying data or even political messaging). It is not surprising that we end up with a bunch of people who struggle to apply an analytic lens to information graphics. This leads to a communications power imbalance that privileges certain kinds of visual devices, including information graphics, over writing inasmuch as information graphics are more likely to be accepted without too much scrutiny since most folks do not have a good idea where to begin to scrutinize them. Information graphics combine the moral authority of numbers with the cognitive inertia of sight that lies behind the cliche that ‘seeing is believing’.

In the service of pulling back the curtain on graphic design, I thought it might be useful to save an entire series of drafts in the development process of a graphic that describes the email traffic in a small design work group. The purpose is to break the seal around the image and reveal it is a series of decisions that might easily have been otherwise.

First Draft

First, I thought a stem and leaf diagram might work.
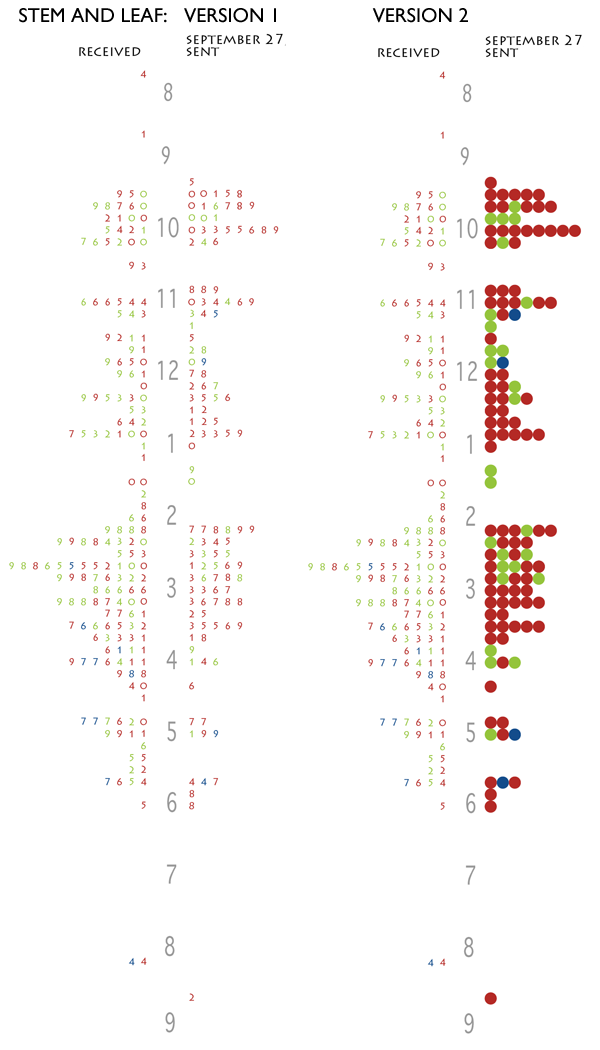
Stem and Leaf diagrams of office email traffic

But these graphics failed because there was no way to keep strings of receiving or sending visually united. If the people in the office happened to be sending (or receiving) a series of email that spanned between one ten-minute period and the next ten-minute period, that run would be visually broken. I also wasn’t thrilled with the way the sent email matched up with the received email. It was hard to see that when one person in the office sent an email, it would often land in the inbox of someone else in the office.

Still, I liked the version where I turned the numbers into balls and that idea came back in a different form later in the development process.

Second Draft

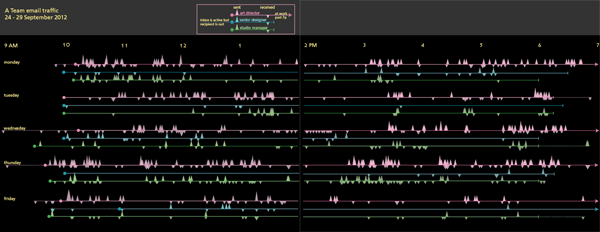
I decided to abandon the stem and leaf for a timeline. I initially imagined triangles as markers for the email because I thought the shape would indicate the directionality of an email going out into the internet.
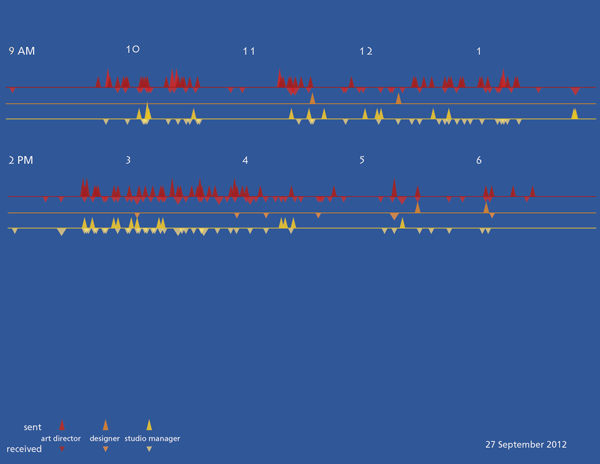
email traffic timeline, version 1
This version has an entire day on one page, morning sits above afternoon.

And I tried some different color schemes.
Email traffic timeline, version 1.1
Email traffic timeline, version 1.1 stretching the day across two pages.
Email traffic timeline, version 1.2

The triangles did not work and some of the color schemes created a sense of vibration. A trained graphic designer might have tried the triangles (and rejected them, of course), but they would not have made the mistakes with color that I did.

Third draft

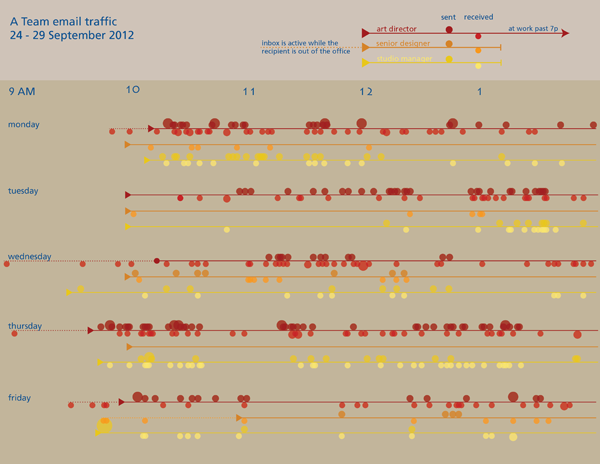
I replotted the graphic with circles, not triangles, and added up all the emails that were received in 5-minute periods instead of plotting each individually. This lost a bit of granularity, but it made it easier to see where traffic was greatest because it allowed the height of the circles start to draw the eye.
Email timeline, version 1.3
There is another page to the right of this one but viewing the image at this scale displays more detail.

This version is much closer to the final but something was missing.

Fourth draft

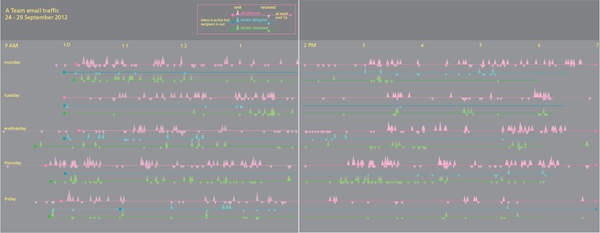
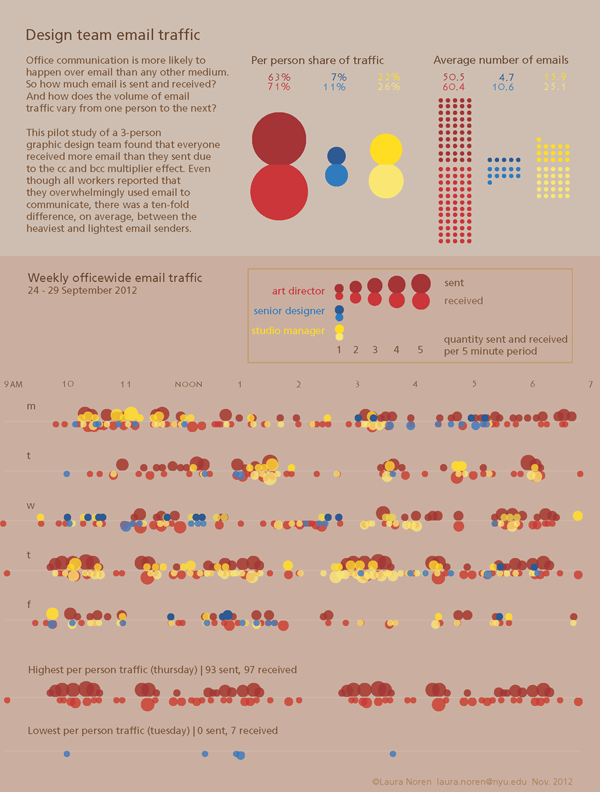
I started to realize that the timelines were difficult to analyze so I went back to the data and pulled out some summary statistics about the average number of emails each person sent and received. I also thought it would be interesting to see how much of the officewide traffic each person generated. While I was looking for new ways to help people understand what they were looking at, I also showed them the range of reality in the same timeline format by pulling out the lines for the highest traffic person-day and the lowest traffic person-day. I also remembered one of the lessons I learned from reading Nathan Yau’s Visualize This and added some descriptive text. [A full review of that book is here.]

Office email traffic

This is as far as I have gotten. But if I get good suggestions in the comments, I’ll keep improving.

What can writers learn from graphic designers

Getting through this many drafts alone was hard. It is very hard to see the same thing with new eyes. I got some help from two different people and even though neither of them said much, their opinions made a huge difference in the process. I encourage writers to find a way to share their work with others earlier in the process. It is humbling. If the comparison to graphic design is apt, earlier sharing either of the whole draft or of smaller sections will also likely lead to a stronger piece that gets written faster.

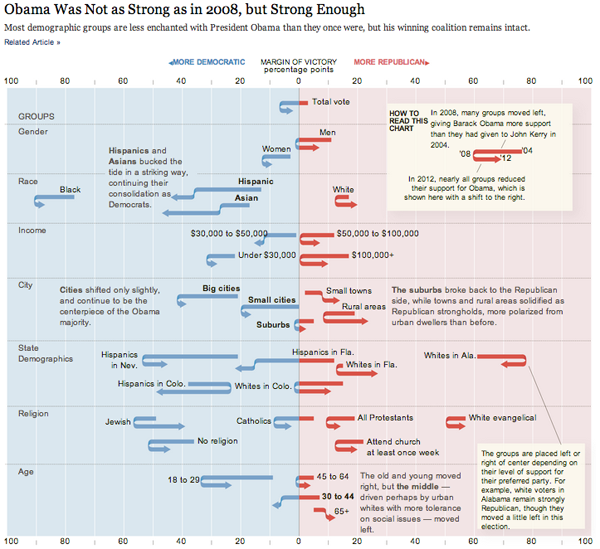
Patterns in political attitudes in US presidential elections from 2004-2012
Patterns in political attitudes in US presidential elections from 2004-2012 | By Amanda Cox, Ford Fessenden and Alicia Desantis nytimes.com

What works

Legend
Legend

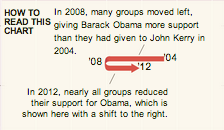
This graphic shows us data over time and is thus a kind of timeline but it uses a graphical device that I have never seen before – the U-turn arrow – to indicate changes in people’s political attitudes at three points in time. This works brilliantly for the dataset and is a strong argument for the use of design and designers in information visualization. A standard timeline would not have worked well with a dataset that has only three points in time that need to be represented for a plethora of categories (the categories are voting blocs in this case). The U-turn arrows allow us to see just how far various voting blocs moved from their 2004 position in 2008 and then again how far they moved in 2012. If the voters in these blocs became more liberal in 2008 and then slid back towards a more conservative position, the arrow makes a U-turn and it’s very easy to visually compare the length of the arms of each side of the U. If the particular voting bloc got more liberal in 2008 and continued towards an even more liberal position in 2012, the arrow does not make a U shape but it still has a kink in it at 2008 so that we can visually compare the length of the 2004-2008 section to the 2008-2012 section. The use of this type of U-turn/kinked arrow is new to me and it’s just brilliant. It’s one of those things that is so easy to understand immediately that we forget we’ve never seen it before. That’s the mark of smart design.

The other thing that this style of timeline does so well is that it allows variation on the starting points of the different voting blocs along the horizontal axis. We get to see that some groups are so far over in the liberal or conservative camps they may never be ‘in play’ and other blocs have voting patterns that push them over the critical boundary in the center of the graphic.

If this type of data were represented on a line graph, the variation in liberal vs. conservative might have been plotted on the vertical axis (though, hopefully this graphic makes it clear that chart conventions can be kicked to the curb at any point in time). Visually, I like the liberal/conservative spectrum better horizontally because it plays with the left-right semantics that are already used to discuss political beliefs.

What needs work

We need more designers working in visualization departments so that we end up with graphics like this that are tailored exactly to the structure of the data and the story it tells rather than trying to select from an existing conventional data representation type.

Kudos to Amanda Cox, Ford Fessenden, and Alicia Desantis at the New York Times.

References

Cox, Amanda; Fessenden, Ford; and Desantis, Alicia. (2012) Obama Was Not as Strong as in 2008, but Strong Enough. [information graphic] New York Times.

LifeMap life timeline | Ritwik Dey

What works

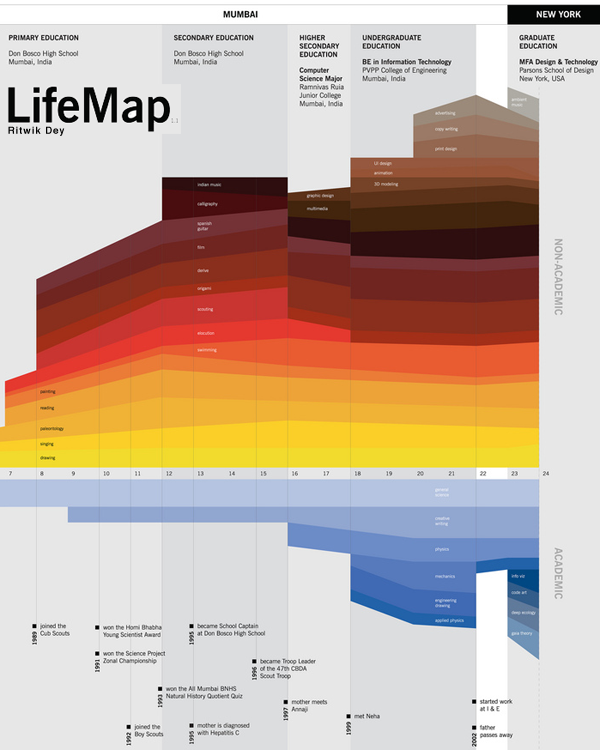
This is a great timeline. If all CVs were displayed like this I think employers would have a much better idea who they’re hiring.

Here’s why I like it:

    LifeMap

  • shows simultaneity – layering colored strips
  • shows relative weights – some stripes are fatter than others
  • shows the split between two classes of life – academic and personal by simply sticking the axis between them and then emphasizing this split with a different color scheme for each class
  • mixes words seamlessly with the graphic elements – each of the activities on the map is listed only once, even if the band it occupies shifts noticeably. Re-listing each element would add clutter and the colors are easy for the eye to follow across the graph even where there are discontinuities.
  • displays location at the top without making location seem like the primary element. It’s hard to get the thing that appears at the top NOT to seem like the most important. Clearly, in the course of a life, moving from Mumbai to New York is a big deal, so this is a critical component, but it doesn’t dominate the graphic. We are able to see the elements that make the leap from one place to the next but we aren’t quite sure if it was the shift from one place to the next or from one level of schooling to the next…and maybe even Mr. Dey doesn’t know. How can anyone untangle the causality of an individual trajectory?

It’s clear to me that many of the design elements here will be useful for future portrayals of social science data. In this case, I’d say we are looking at an enhanced CV, brave enough to indicate the passing of a parent and even a mother’s new relationship (which preceded the passing of the father). Spare visual narrative, intriguing in what is left out, remarkably rich nevertheless.

What needs work

The font relative to the graphic is too small. I know that this was probably intended as a poster and displayed at such a scale that the font wasn’t a problem. I apologize that you have to click through to see all of the categories.

Another comment while we’re on the topic of fonts and words relative to graphics: Mr. Dey was able to describe all of his interests with one or two words. It looks great. He expanded his accomplishments a bit beyond the two word limit, but they are still quite brief. I like the idea of choosing the one, two or three most precise words and making sure the graphic itself can carry the rest of the message. It’s a good test to see if your design is helping – when it can speak almost on its own things are looking good.

The limited number of words makes the whole thing not only visually and verbally poetic but also increases its functional value. One of my functionality measuring sticks is the number of words a person would have to translate if they were trying to read this graphic in a foreign language. The fewer words, the easier it is for non-English speakers. The more specific the words are, the more likely they are to translate appropriately. Therefore, ‘swimming’ and ‘3D modeling’ probably translate without difficulty. I have no idea if there is any kind of meaningful translation of “scouts” or “scouting” in any language other than English, but that is not a problem any graphic designer is going to be able to solve.

I wonder, though, if no-more-than-two-words rule led to the choice of the word “derive”. I know what that means in the context of calculus. I have no idea what that means in the context of a LifeMap, but it remains salient for years so I wish I did know what it meant. Sometimes the word restriction rule leaves out the phrase that would best describe whatever it is you might be trying to describe. Or maybe Mr. Dey does a lot of theoretical derivations.

References

Dey, Ritwik. (2005) LifeMap Project for Information Design course with Dmitry Krasny at Parsons School of Design in New York City.

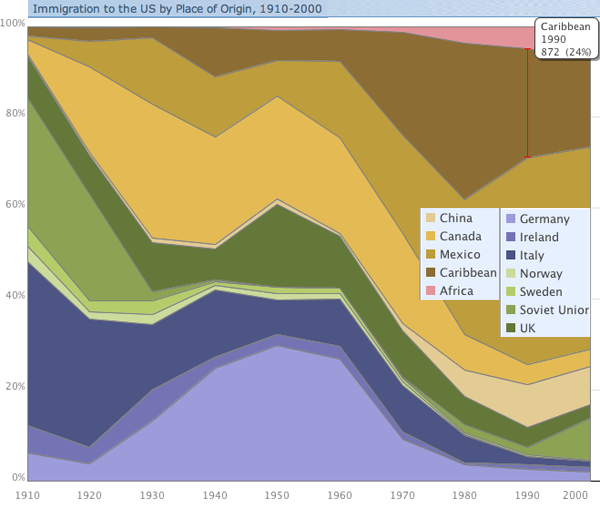
Immigration to the US | Absolute Numbers
Immigration to the US | Absolute Numbers, courtesy of Thomas Brown and IBM's Many Eyes Tool


Immigration to the US 1900 - 2000 | Relative flows from sending countries
Immigration to the US 1900 - 2000 | Relative flows from sending countries, courtesy of Thomas Brown and IBM's Many Eyes Tool

What Works

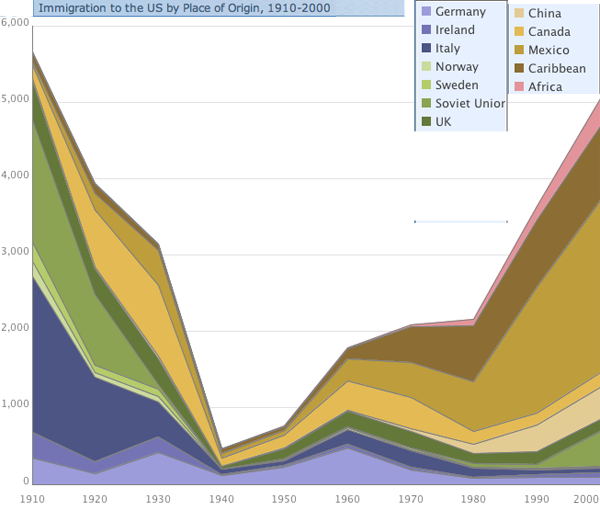
Before you read any further, ask yourself which one of these graphs is most useful. Which one has the most information? If you had to get rid of one of them but still be able to explain the basic flows of people into the US over the last century, which one would you keep? And would your story be much weaker, somewhat weaker, pretty much the same after the loss of one of the graphs?

First, I was moaning the other day about a graphic – like the one I posted recently about prescriptions for treating mental illness in the US – in which color is used to make it look like there is important information being encoded when, in fact, the colors are just pretty, nothing more. I am happy to report that in this case, the colors are not only useful, but necessary. Try to imagine looking at this thing in gray scale. It would be nearly impossible to read. So kudos for color in general. In specific, I probably would have tried to group the countries that are near each other in the world within a color family. Sweden and Norway are good examples of what I would have done throughout – they are both green, just different shades. That makes good logical sense. On the other hand, Ireland and the UK are not in the same color family and it confuses me. I also don’t see great geographic or other similarities between Canada/Mexico and China. So I would have kept the Canada and Mexico as they are and found a different color for China.

Now I’m going to get back to the question I asked at the beginning of the post: could you do without one of these graphics if you had to axe one? It’s a leading question and the answer is clearly: yes. The first one is far better than the second one. Looking at absolute flows by country of origin gives a much more interesting and fully articulated picture than looking at the relative values of people coming at any one point in time.

What Needs Work

The numbers behind this graph were pulled from Census Data, a good place to go because they are the most reliable numbers we are likely to find (at least with respect to legal immigration – undocumented immigration is, well, undocumented so the Census doesn’t help). However, the thing about Census Data is that it’s going to show us flows for a decade at a time and I wonder if it might be a little misleading to show these numbers as an augmented line graph. A bar graph might be better and here’s why: smoothing the lines implies decade reliant time trends that don’t exist. Unfortunately, in the real world, important decisions do not always take place in the same year the census is taken. The Immigration Reform Act of 1965 was right between decades. Now I know you’re thinking something along the lines, ‘anyone who studies immigration is going to know when that reform act was and when WWI, WWII, the Depression, and all sorts of other important historical events took place. we’re not idiots.’. I agree; you are not idiots.

On the other hand, if I were to create this as a bar graph, I would have the freedom to actually locate the legislation as a graphic element – a line flying a flag announcing the name of the act, for instance – right between the bars for 1960 and 1970. But of course, that would make it difficult to see how the flows are changing over time, so I might superimpose a kind of shadow version of the current line graph over (or under) the bars so that the eye can be aided in its path from one bar to the next. Line graphs do show change much better. But I like the idea of being explicit with the time periods in which the measurements occur and with the notion of leaving graphical space to add important contextual details.

This graphic was created by Thomas Brown using IBM’s free Many Eyes visualization tool. I wholeheartedly support IBM and the other companies and organizations that are making powerful visualization tools available for free. In case you aren’t familiar with them, they allow users to input data and then they take that data and produce visual representations of it. In this case, the full version of the graph is interactive – hovering the mouse will reveal greater detail about any given flow at a point in time. This is a great thing. I support layering of information. The layering available at Many Eyes does not quite make up for the inability to layer in the way that I described above, but I’m not disappointed with IBM. There are already tools for manipulating graphics. The best way to use IBM’s tool is not to expect it to do everything, but to take their visualizations and then further enhance them in photoshop or your favorite image editing software.

Also Note

This graphic is about spaces but it is not a map. For whatever reason, people use maps whenever there is mention of geography, and even sometimes when there isn’t, even though the map is often not adding to the story and making it harder to immediately grok what the important patterns are. Just because geography or mobility might be part of the story you are trying to tell, it isn’t necessary to use a map to encode your narrative visually.

References

Thomas F. Brown. Immigrant Origins via email on 11 October 2010.

IBM’s Many Eyes data visualization tool.

US Census Historical Statistics for Immigration by Number and Rate and Immigration by Leading Country or Region of Last Residence.

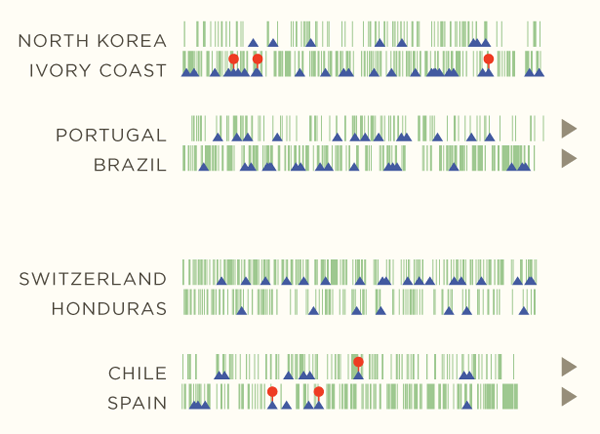
Diagram of a World Cup Game | Michael Deal, Umbro Blog

What works

Right on, no? I think so. This comes to us from the Umbro blog where a much bigger version is available, designed by Michael Deal.

This graphic simplifies a match into completed passes, shots on goal, and completed goals. Each completed pass gets a thin green bar – no difference for the length of the pass (good decision, Michael) – which has the visual impact of displaying possession across the course of the game. And we all know how important possession is. Then the blue triangles show shots on goal and the red balloons show us where goals are made. The success of this graphic is a result of the simplification – we have only three channels of information – possession, shots on goal, goals. There was no attempt to break the team down into its constituent members, which was probably the most important decision. There was also no attempt to do much with numbers – no percentage of time under possession, no counting up all shots on goal, no display of penalties in any way.

Before I forget, this is a time line. The main organizing axis is time. In fact, the only organizing axis is time. There was no attempt to represent space. Great decision because representing space – like some map of the field – would have muddied up the message beyond recognition. Take home point: when the goal is to show change over time, just stick to time and leave space out of it. We all know what the soccer field looks like and we all know that it’s hard to take a shot on goal from far away.

To the right of the graphic proper, the little grey triangles show which teams moved on from the round of 16.

What needs work

For the football neophytes, I would have loved to see a small number where the little grey triangle appears (except for every game played by every team) that showed how many points the team racked up during that match. In the first round, I know lots of US fans had trouble figuring out the round robin scoring system all added up. And even if you are totally familiar with the rules of the scoring system, it got to be difficult to play out all the hypotheticals – I happened to be sitting in a room full of MIT PhD students during one of the early Germany games that was being played at the same time as a critical match in the same group. There were many, many hypothetical outcomes accruing different scores in group play that had to be imagined and added up in order to understand Germany’s chance of moving into the round of 16. Sorting them all out was not easy, not even for ten MIT PhD candidates. Having a little chart that at least kept clear which points had already been earned would have been useful.

On representing space
I know I said Deal didn’t need to represent space because the point was to show change over time. However, I had some thoughts about how he might have been able to represent space in football-centric ways that would not have cluttered up the simplicity of the visual.

If the length of the passes were represented by the length of the green bars (maybe in a 4-step range progression), would we have been able to detect differences in styles of play from one team to the next? Or from one time period during the game to the next? I know that this would have added much more time during the creation of the graphic without increasing the value all that much. But it would have been one way to give each team a little specificity. Right now, the only way we know which team is which is by looking at the names. If, say, one happened to know that Spain plays a short game, then we might have been able to recognize the Spanish-ness of a time line full of short green bars.

One other thought on representing space, shots on goal from inside and outside the box could have been rendered in different saturation levels of the same color. Keeps things simple but adds depth to the information displayed.

References

Umbro Blog. (30 June 2010) Football As Art: the vital stats as you’ve never seen them before.

Deal, Michael. [graphic designer] Michael Deal’s graphic design site.

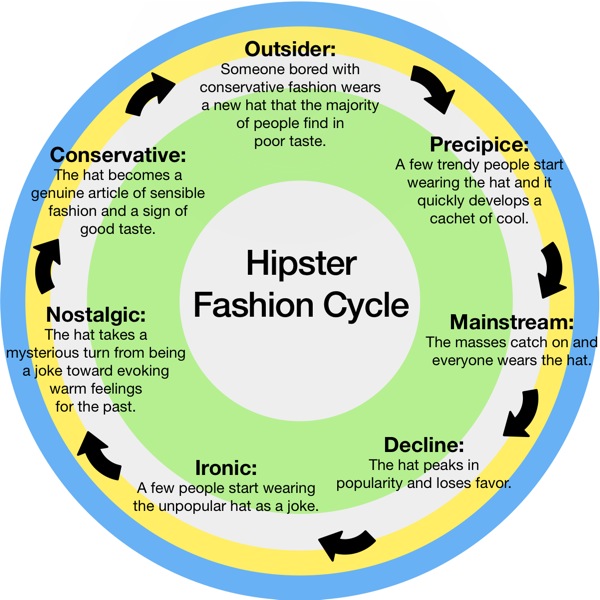
Hipster Fashion Cycle | Emily Miethner

What works

Compare this graphic to the post via Wired about new data-mining research methods shortening the time to market for new drugs. Both employ a more or less circular timeline. This one works because it is meant to discuss a proper cycle – the same hat is seen through a sort of fashion kaleidoscope of attitudes but the hat doesn’t change and the attitudes follow a more or less predictable pattern that is cyclical, not linear.

What needs work

I was expecting more hipster sensibility in the graphic – maybe a discussion about the ironic use of emoticons. The oblique reference to trucker hats didn’t quite do it for me because I spent the whole time wondering if I was wrong about trucker hats and she really meant fedoras. A bit of hipster fashion signposting would have been useful. For example, are super skinny jeans for young men mainstream cool or ironically cool or not at all cool any more among hipsters?

Reference

Miethner, Emily. (28 June 2010) Hipster Fashion Cycle. Courtesy of flavorpill via notcot.

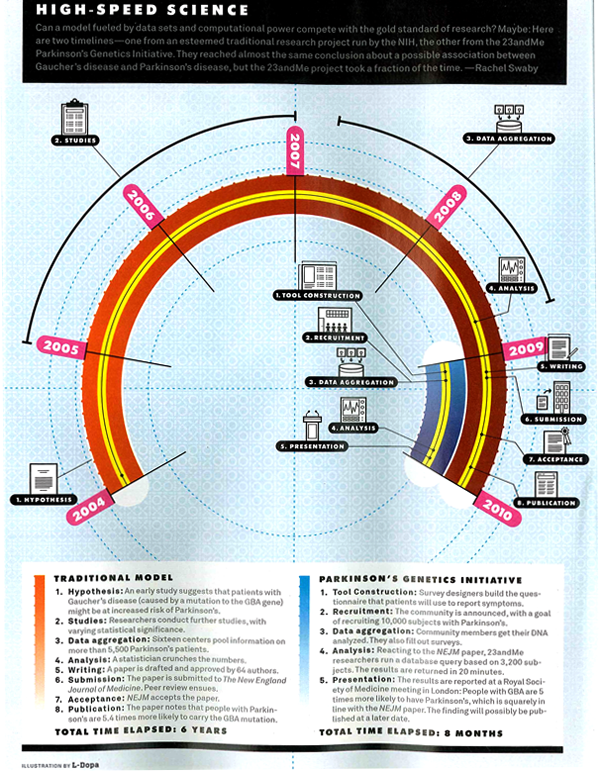
Getting drugs to market faster, timeline graphic | Wired Magazine May 2010
Getting drugs to market faster | Wired Magazine May 2010

What works

I am not a huge fan of this graphic though I admit it works better in print than it does in this crappy scan of the print article. My apologies. Click through here for a crisp version.

In summary, the article is about the way that research is done in the presence of many more data points (specifically, complete DNA maps of numerous individuals) and much more processing capacity. They argue using a case study revolving around the personal story of Sergey Brin who is at risk of developing the as-yet-untreatable Parkison’s disease, that data mining means research will progress much faster with no loss of accuracy over traditional research methods. They use a medical research case so they get to conclude that moving to data mining will mean people who might have died waiting around for some peer review committee (or other tedious component of double-blind research methodology) will live. Hallelujah for data mining!

They summarize their happiness in this Punky Brewster of a timeline.

What needs work

First, why did the art director order a timeline and not a diagram about how the assumptions underlying the research method have changed? It is clear that the article is taking a stand that the new research methods are better because they are faster and, in the case of Parkinson’s, could save lives by speeding things up. That is undoubtedly true, as it would be for any disease for which we currently don’t have anything that could be referred to as a “cure”. However, as a skeptical sort of reader, I find it difficult to simply believe that the new data-mining variety research is always going to come up with such a similar result – “people with Parkinson’s are 5.4 times more likely to carry the GBA mutation” (hypothesis driven method) vs. “people with Parkinson’s are 5 times more likely to carry the GBA mutation” (data-mining method). If the article is about research methods, which is ostensibly what it claims. However, featuring the chosen cause of e-world celebrity Sergey Brin could indicate that Wired doesn’t so much care about changing research methods as it cares about selling magazines via celeb power. Fair enough. It’s kind of like when Newsweek runs a cover story about AIDS in Africa accompanied by a picture of Angelina Jolie cradling a thin African child. Are we talking about the issue or the celebrity? In this particular article, it seems to me that if the core message were to focus appropriately on the method, the graphic could have depicted all of the costs and benefits of each research model. The traditional model is slower but it makes more conservative assumptions and subjects all findings to a great deal of peer review which offers fairly robust protection against fallacies of type 1 and type 2 (ie it protects us from rejecting a true hypothesis as false and accepting a false hypothesis as true). In the data mining scenario, since the process begins not with a hypothesis but with the design of a tool, there are reasons to believe that we may be more likely to run into trouble by designing tools that too narrowly define the problem. A graphic describing just how these tools are constructed and where the analogous checks and balances come in – where are the peer reviewers? What is the hypothesis? How do data-miners, who start by developing tools to extract data rather than hypotheses in line with the current literature, make sure they aren’t prematurely narrowing their vision so much that they only end up collecting context-free data (which is basically useless in my opinion)?

Don’t get me wrong, I am excited by the vast quantities of data that are both available and easy to analyze on desk top computers (even more can be done on big work stations and so forth). Caution is in order lest we throw out all that is reliable and robust about current research methods in favor of getting to a result more quickly. We could use the traditional hypothesis driven, double-blind kind of trial procedure coupled with the power of DNA analysis and greater processing capacity. It’s somewhat unclear why we would abandon the elements of the traditional scientific method that have served us well. There is a way to integrate the advances in technology to smooth over some of our stumbling blocks from the past without reinventing the wheel.

Concerns about the graphic

My second major problem is that this graphic is one of a type commonly referred to as a ‘time line’. In this case, what we appear to have is a time line warped by a psychedelic drug. This might, in fact, be appropriate give that the article is about neurology and neuropathy. Yet, the darn thing is much harder to read in the Rainbow Brite configuration than it would be if it were, well, a line. Time. Line. And the loop back factor implies that there is going to be a repetition of the research cycle starting with the same question (or dataset) all over again. That’s sort of true – the research cycle has a repetitive quality – but it is not strictly true because hopefully the researchers will have learned enough not to ask the exact same question, following the exact same path all over again.

References

Goetz, Thomas. (July 2010) Sergey’s Story Wired Magazine.

Wired magazine. (12 March 2009) Science as Search: Sergey Brin to Fund Parkinson’s Study on the Wired Science blog.

23andme (11 March 2009) A New Approach to Research: The 23andMe Parkinson’s Disease Initiative. [This was an early announcement about this project from 23andme who offered the DNA analysis].

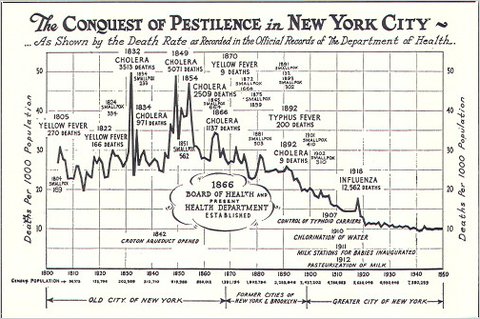
Conquest of Pestilence | Courtesty of New York City Dept. of Health via Glaeser

What works

Ah, old-timey graphics. What works here is that this graphic reveals how far we’ve come, I think. The purpose is to show what percentage of New York City’s population died, annually. We can see the trend jumps around a bit – infectious diseases cycle through, sanitation improvements are made, the demographics of the population change – but mostly trends downwards. I like the inclusion of information about deadly diseases though I wouldn’t have just stuck labels on the peaks. The labels here clutter up the graphic territory and do not leave any room for adding other kinds of helpful trendlines and so on like that.

What needs work

Of course, there is not nearly enough context to make proper sense of this information. The implication is that the general downward trend is due to public health improvements, so of course the spikes are all labeled with diseases. I do not dispute that people were dying from cholera or typhus, I just want to hear more about what might have been causing people to LIVE (rather than just seeing what was causing them to DIE). What about demographic changes that shifted the population towards and then away from a preponderance of new immigrants? From young babies to slightly older people (who used to be at risk of death more than children and adults)? What of other changes (like, say, improvement in building codes that made the Triangle Shirt Waist Fire an anomaly rather than one of many similar situations)? What about income levels? The assumption is that as income rises, death rates drop, but I’d like to see that represented because it’s unclear just how rising income is linked to public health measures. Are we healthier because our increased contributions to the general fund (through taxes) go to support public health? Or is there simply something about being richer – either as individuals or as a collective – that leads to better health independent of the direct funding of public health?

More to come on Time Lines

I’m working on timelines this week but I want to create something new rather than just talking about existing ones which is going to take me some time. It will be a group effort, I strongly encourage you to send in your favorite time lines, your least favorite time lines, and comments about the time line I put together once I’ve got it posted.

Thanks much.

References

Glaeser, Edward. (22 June 2010) The Health of the Cities in The New York Times, Economix blog.

New York City Department of Public Health. [the image]