graphic by L. Norén

Blog reading and writing graph by gender, 2000-2010 | Pew Internet Research
Blog reading and writing by gender, 2000-2010 | Pew Internet Research

What works

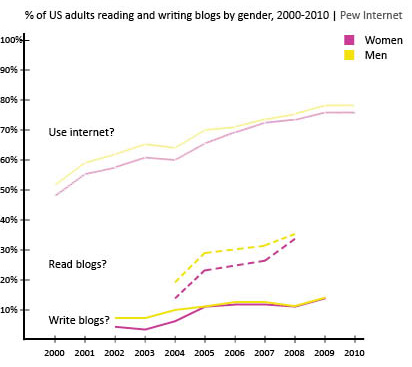
This graphic was created using a wonderful, if not entirely complete, massive Excel spreadsheet summarizing interview results from the Pew Internet Project. There are many more questions than the three I looked at. I am primarily interested in how many adults write blogs and I was happy to see that the Pew Internet Research center has been asking adults about their blog reading and writing practices for about a decade. Just to give it context, I also plotted the percentage of adults using the internet at all.

I am also interested to see that women and men write blogs at about the same rate, these days, even though I know that they aren’t writing the same kinds of blogs. Food bloggers, for example, are overwhelmingly women as are baby bloggers (aka mommy bloggers, but using the term ‘mommy’ is too gender-restrictive). Political bloggers and tech bloggers tend to be male more often than not, though I know less about them.

What needs work

The interviews are different from year to year – some years I was averaging five or seven data points on the same question and some years I had only one (or, sadly, none). I wish there had been more years of data available on blog reading, for instance.

If I had one takeaway point it would be that we need to keep funding places like Pew to conduct detailed, ongoing research. I have found it invaluable to have access to their research and it makes the work I am currently conducting about food bloggers relatable to a wider body of practices.

References

Pew Center for Internet Research. Usage over time spreadsheet.
— If you cannot click on that link and automatically start a download, try downloading it from the Pew website

Food Blog Study | Web Crawler Progress Egg

Food Blog Study Update

I heard there was a graduate student once who used egg timers to break her dissertation down into writeable chunks. She had these timers all over the apartment, flipping one over to start a new bout of writing. Once it ran out, she might keep on writing since there was no buzzing or beeping to interrupt her. If she looked up and the sand had all run through, she would flip over another egg-timer to measure out a dose of ‘free-time’. Maybe I had her strategy in mind while I was trying to come up with a way to monitor progress on the food blog study. Large, long-term projects can envelope me, making it hard to see either where (and why) I started the project and where I mean to end up while I’m toiling away in the trenches of the day-to-day. This post is not about a final product. Rather it is about how I use information graphics to help me keep my mind on both the questions I started with and the place I mean to end up when all is said and done.

The food blog study is broken into three parts. The interviews (N=22) have all been conducted and are out being transcribed. The survey cannot begin until the web crawler has gotten to a stopping point. So where do things stand with the web crawler? That is not an easy question to answer except to say that it is doing what good bots do, chugging along finding food blogs to add to its growing collection with minor down times for maintenance here and there.

The graphic above demonstrates how the network set is growing – I simply used the file size of the daily cumulative db output to tell me how big to make each day’s egg. Still, looking at file size is kind of silly – it does not help me figure out when the network has been sufficiently crawled. It simply represents the absolute size of the database and because I do not have some target absolute size as my endpoint, knowing the current absolute size is mere trivia and not analytically useful.

Rather than considering absolute size or the linear growth of the network data, it is a lot more meaningful to examine the rate of change of new nodes from one day to the next. For comparison sake, I graphed both the linear growth of the network (top graph) and the number of nodes added per hour for each day in July (bottom graph) with the exception of July 17th when the crawler was down for maintenance. The linear growth is chugging along consistently enough with a few exceptions for reasons like maintenance and accidents (someone unplugged my computer from the internet for six hours one day. oops.). The rate of new food blogs added to the network set per hour is finicky, a pattern that is much easier to see in the bottom graph. That graph was calculated by taking the number of new food blogs added to the network during a given run and dividing it how long the run lasted to generate an hourly rate of growth. That hourly rate is what is plotted below – the crawler’s sweet spot seems to be when it is adding about 60 – 90 new food blogs per hour.

Food Blog Study | Graphs of Web Crawler Progress

The plunge in the rate of new blogs added per hour around the 18th of July is artificial. I happened to add a command that day which retroactively removed all of the blogs primarily focused on cocktails, wine, and beer. Their removal nearly outweighed the new food blogs that were added to the network that day so the overall rate of new blogs added appears to be extremely low at only 6 per hour.

This graph is extremely useful for keeping in mind where I started and helping me to figure out when I have gotten some where. I will know that the food blog bot is exhausting new nodes and that I have started to run into the bounds containing the food blog network when the rate of newly discovered food blogs per hour starts dropping and does not recover. Right now, the crawler is still pulling in new entries fairly rapidly so I know I am probably going to be babysitting it for at least another week. Thus far, the roughly-cleaned network includes about 32,000 nodes. Yes, folks, that means there are greater than 30,000 food blogs out there in the world. Probably a lot more, especially because the bot speaks food in English, Spanish, French, Italian, and German so the network under consideration is multi-national though not quite global.

Note on graphics

Could that egg have been perfectly round? Yes. And would perfectly round circles have been easier for average humans to measure with their eyes? Yes. So why did I choose an egg shape? Because I feel like this project is an incubation period. Data collection can be a delicate process – I would say that is especially true with respect to the web crawler because it was a tool custom-built for this project and thus has not been used and tested elsewhere. I also chose an egg because it is not important if viewers understand exact figures – this graphic was intended to provide an impressionistic view of the rate of growth of the network that the crawler is gathering. It grows incrementally, not by leaps and bounds. Like tree rings, the concentric nature of these eggs demonstrates that some days generate fatter rings than others.

As for the two graphs, I wanted to try using the same horizontal access because I wanted to make sure people understood that those two graphs are best understood as a pair. Basically, one is the derivative of the other, though there’s no need to pull out your calculus textbook just to understand these two. The top one just shows the total number of food blogs in the network so far. The bottom one shows how fast new blogs are being added from day to day. I didn’t want to clutter up the graphs with too many words so I opted to go with a single horizontal access, short titles, no labels for the vertical access (they are implied in the title), and I kept the two points about strange days outside of the bounds of the bottom graph. I don’t know if it is acceptable to stick asterisks in a graph, but I did it.

References

Noren, Laura. (2011) Food Blog Study.

Water Supply Infrastructure Schematic
Water Supply Infrastructure Schematic | Laura Norén

Water Infrastructure Schematic Diagram*

I put together the diagram above to help me explain how water is delivered and taken away from urban locations. The point I want to make with the diagram is that the infrastructure is designed to deliver water to ‘typical’ buildings and that this means people who are wandering around cities where buildings are all private also lack access to water. There is a political debate going on right now about whether or not access to water is a human right – the UN voted on this and decided water IS a human right but large countries like the US disagreed. When the US does not back UN resolutions, those UN resolutions tend not to mean as much.

So why would the US vote against this resolution? I am not altogether sure, but I believe it has something to do with the fact that many places have privatized their water. Privatization of water takes different faces. Sometimes a system like the one diagrammed above is privatized. Studies have shown that when this happens, the company that sets up a system like the one above delivers a poorer quality product – more sedimentation and other low level contaminants which are the typical results of choosing sources quite close to cities. The closer the source is to the delivery, the lower the expenditure for engineering and installation of water mains, monitoring stations along the route, and reservoirs. The other way in which water can be privatized is through bottling – bottled water in some parts of Africa is more expensive than Coca-Cola. And this in areas that may have no access to safe alternatives for drinking water. Nestle owns the Poland Springs brand and folks in Maine are scrambling to get hydrological studies performed that can prove Nestle’s water extractions are drawing down lake volumes on adjacent properties. The only way to fight Nestle, it seems, is to prove that they are damaging one’s own property and yet water sources – rivers, lakes, oceans, springs – technically do not belong to private individuals. The individuals or corporations can own the land surrounding them, but the water is a bit like air and cannot be owned. (Rights to the fish found in the water CAN be owned. As you can see this gets complicated quickly.)

The diagram above contains none of the politics of the discussion below. For me, it is important to attempt to create graphics that are not political, even when I am creating them for the express purpose of delivering a presentation that takes a side in a political fight. For me, the challenge is two-fold. First, I face the technical difficulty of creating any kind of complex diagram. I’ll leave questions about execution out of this particular discussion though feel free to comment on execution below. Second, when I know I have a political message that I want to keep out of my graphics, I am often too far into my own head to be able to step back and determine whether I have created something that is both comprehensive enough to tell a complete (but apolitical) story and one that does not drift into the political. As it is, this diagram seems to err on the side of being incomplete rather than being more fully detailed where the details start to carry politics with them. My larger point is that this is one way in which cities are exclusionary zones by design. It would be easy to find a way to provide the basic infrastructure to supply water outside of buildings – fire hydrants do just that. But maintaining the ‘last mile’ of infrastructure is almost always completely given over to the private sector. Individuals and companies maintain bathrooms with all of their fixtures, cleaning, and maintenance requirements. This is big business. Just about every shop and restaurant on the street in New York reserves the rights to the bathroom for customers only.

2nd Avenue "no bathroom" sign, East Village, New York City (2009)

One of Starbucks redeeming qualities is that their bathrooms tend to be open to all, proving that it is possible to continue to service a relatively affluent clientele no matter who is in the bathroom.

Obama on Water

The word on the political street is that even though Obama’s stimulus efforts contain plans to address infrastructure, water infrastructure has been taken off the table at this point. Our water infrastructure is ageing; most of the current infrastructure is due to age out of acceptable functionality in the next ten years. Already there are an average of 240,000 water main breaks. Just yesterday the New York Times reported that a dam outside of Bakersfield is uncomfortably close to catastrophic failure, threatening the lives and livelihoods of thousands of people. There are another 4400 dams in the US that require work in order to fall within comfortable safety ranges. Some are publicly owned, some are privately owned. In either case, it is unclear which entities can foot the bill (projected at $16 billion dollars over 12 years).

*This diagram uses New York City as a guide. Not all cities have overflow valves that risk the release of raw sewage due to increases in rain. What’s more, in New York there are some other systems in place to recapture some of the overflow at the point of release. But this is a different kind of political discussion, one that focuses on the other typical focus of water discussions – the environment.

References

Ascher, Kate. (2005) The Works: Anatomy of a City. New York: The Penguin Press.

Bone, Kevin, ed. and Gina Pollara, Associate Ed. (2006) Water-Works: The architecture and engineering of the New York City water Supply. The Cooper Union School of Architecture, New York: The Monacelli Press.

Bozzo, Sam. (2009) Blue Gold: World Water Wars [Documentary film, available streaming for free]

Davis, Mike. (2006) Planet of Slums. Brooklyn, NY: Verso Books.

Fountain, Henry. (2011) Danger Pent Up Behind Aging Dams. New York Times. 21 February 2011.

Axes of Peeing in Public
The social and biological axes of public peeing

What works

This was something I used to help me think through the two main axes that determine peeing behavior – biological and social control. Urination is a biological function that has been subjected to a great degree of social control. Unfortunately, urban design has not kept pace with the demand for clean, easily accessible public restrooms for humans. And there has been no attempt to create any kind of system to deal with canine urine. In most cities it is illegal for humans to pee in public but both legal and widely accepted for dogs to pee where ever they like (in New York, they cannot pee on the grass in parks).

What worked about this as a graphic is that it helped me sort out how I was thinking about the problem of access to the city when the bladder is a leash. I couldn’t quite sort out how to think about what it means that some public peeing is acceptable even though it is mostly completely unacceptable. One of the odd side effects of the introduction of the new TSA pat down procedures is that it revealed just how many people struggle with incontinence, either needing to urinate frequently or needing to wear diapers (or both). I was aware of those issues before the TSA started sticking their hands in private places, but I wasn’t sure how to simultaneously think about adult diapers, dogs peeing on the street, and taxi/truck drivers peeing in jugs while still in their cabs. Where social control is very strong – as it is in the case of urination – it can almost trump biological needs, especially if the biological needs offer a level of control. Clearly, not all peeing can be put under biological control, but a good deal of it can. I stuck vomiting on the map since that is harder to control than peeing and it was useful to include a biological drive that has not been so easy to tame with the civilizing process.

What needs work

The glaring problem here is the ‘who cares’ problem. Very few care about the axes of social and biological control, though there are a few other case types that could use these axes (burping/farting, posture, chewing, etc). But the re-use of this exact same set of axes is not the point. Nor do I particularly care if you are interested in public peeing.

I introduced this graphic because it was helpful to me in thinking through the analysis of a multi-faceted problem. All social science problems are multi-faceted. Setting up four quadrants as a field is superior to setting up four quadrants in a two by two table, though that is a variant of this approach. I find that approach is too reductive, forcing things to be lumped together that really are not all that similar. In this case, I was able to add more nuance by leaving the mid-section of the biological control vector unmarked while I singled out incontinence and retention (where retention is beyond routine continence).

This approach to thinking through forces you to come up with the two critical dimensions that organize both the empirical information you’ve gathered and the theoretical arc you would like to follow. If you are skilled, you could add a third dimension. A 2×2 table only gives you boxes, not spectrums. What’s more, the spectrum approach is more open, allowing the addition of further segmentation or layering which is not as easy to achieve in a 2×2 table.