What works
Over the summer I surveyed 280 English-speaking food bloggers who were randomly drawn from a network of 23,000. Only the bloggers with email addresses, contact forms, or twitter accounts were invited to participate (obvious reasons…if I couldn’t get in touch with them, I couldn’t invite them to participate).
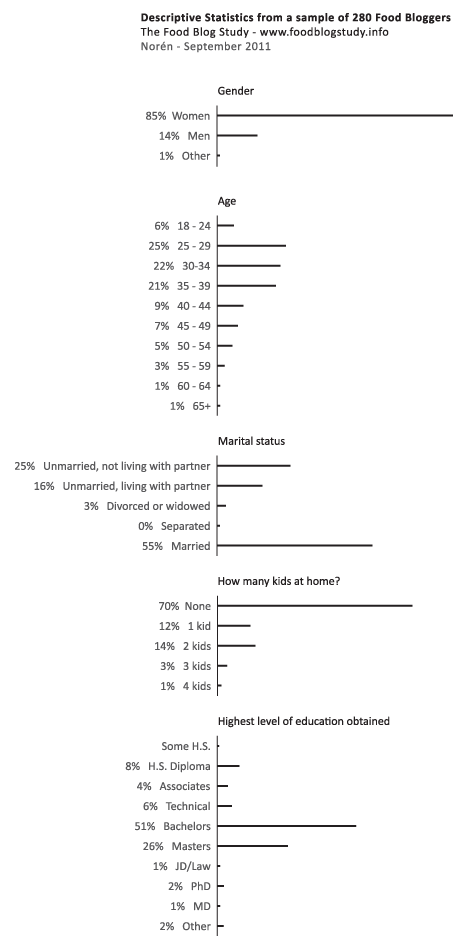
The graphic above represents my first attempt to present some of the basic descriptive statistics – gender, age, marital status, educational attainment, number of kids – just to see what works visually. Normally, this kind of information is presented in tables (I have those, too), but I wanted to try to add some horizontal bar graphs for impact. I kept them horizontal so that the axes labels would be easier to read.
The percentages are listed; the frequencies are represented visually.
Just for comparison sake (which is kind of difficult): the average age of people in the US is 37.2 (it’s 38.5 for females); about 50.5% of Americans are married now and only 2.5% are cohabiting. As for education, 28.5% didn’t get another degree after H.S., 17.7% stopped after their bachelor’s degree, and 10.4% have professional degrees. Clearly, the food bloggers are well-educated and more likely to be cohabiting than the American averages. I added these comparisons in response to Rob’s request. I know it would have been better to add them to the graphic, but the comparisons are a little tricky because the Census data is looking at a wider age range and I haven’t found any good summary stats on bloggers in general (which would be better than the aggregate comparison to the whole national pool).
What needs work
This strategy would not work for the entire set of variables – boring after a while. I am trying to think of better ways to show more variables at once without just building a column that goes on and on forever.
For more on “what needs work” see the comments section.

Comments 6
Chris Lysy — September 29, 2011
Curious, why don't you identify the food blog aggregator? I understand keeping the survey data confidential, by why keep the source confidential?
Rob — September 29, 2011
I'd love to see these compared to the demographics of the US, the English-speaking world, internet users, or bloggers.