Uncategorized

Patterns in political attitudes in US presidential elections from 2004-2012
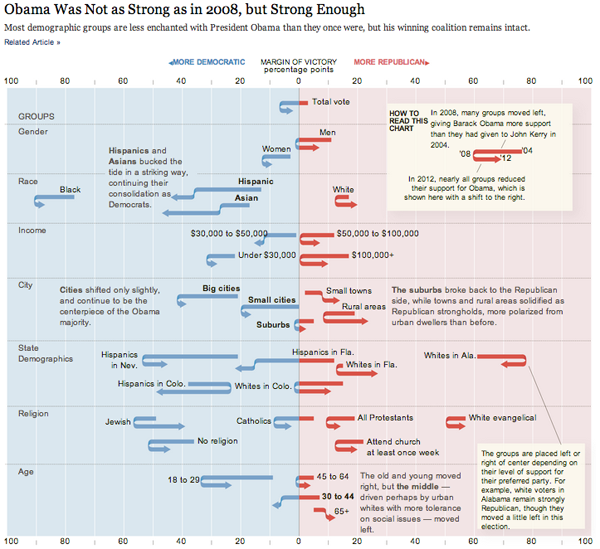
Patterns in political attitudes in US presidential elections from 2004-2012 | By Amanda Cox, Ford Fessenden and Alicia Desantis nytimes.com

What works

Legend
Legend

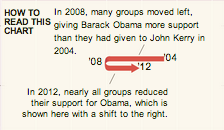
This graphic shows us data over time and is thus a kind of timeline but it uses a graphical device that I have never seen before – the U-turn arrow – to indicate changes in people’s political attitudes at three points in time. This works brilliantly for the dataset and is a strong argument for the use of design and designers in information visualization. A standard timeline would not have worked well with a dataset that has only three points in time that need to be represented for a plethora of categories (the categories are voting blocs in this case). The U-turn arrows allow us to see just how far various voting blocs moved from their 2004 position in 2008 and then again how far they moved in 2012. If the voters in these blocs became more liberal in 2008 and then slid back towards a more conservative position, the arrow makes a U-turn and it’s very easy to visually compare the length of the arms of each side of the U. If the particular voting bloc got more liberal in 2008 and continued towards an even more liberal position in 2012, the arrow does not make a U shape but it still has a kink in it at 2008 so that we can visually compare the length of the 2004-2008 section to the 2008-2012 section. The use of this type of U-turn/kinked arrow is new to me and it’s just brilliant. It’s one of those things that is so easy to understand immediately that we forget we’ve never seen it before. That’s the mark of smart design.

The other thing that this style of timeline does so well is that it allows variation on the starting points of the different voting blocs along the horizontal axis. We get to see that some groups are so far over in the liberal or conservative camps they may never be ‘in play’ and other blocs have voting patterns that push them over the critical boundary in the center of the graphic.

If this type of data were represented on a line graph, the variation in liberal vs. conservative might have been plotted on the vertical axis (though, hopefully this graphic makes it clear that chart conventions can be kicked to the curb at any point in time). Visually, I like the liberal/conservative spectrum better horizontally because it plays with the left-right semantics that are already used to discuss political beliefs.

What needs work

We need more designers working in visualization departments so that we end up with graphics like this that are tailored exactly to the structure of the data and the story it tells rather than trying to select from an existing conventional data representation type.

Kudos to Amanda Cox, Ford Fessenden, and Alicia Desantis at the New York Times.

References

Cox, Amanda; Fessenden, Ford; and Desantis, Alicia. (2012) Obama Was Not as Strong as in 2008, but Strong Enough. [information graphic] New York Times.

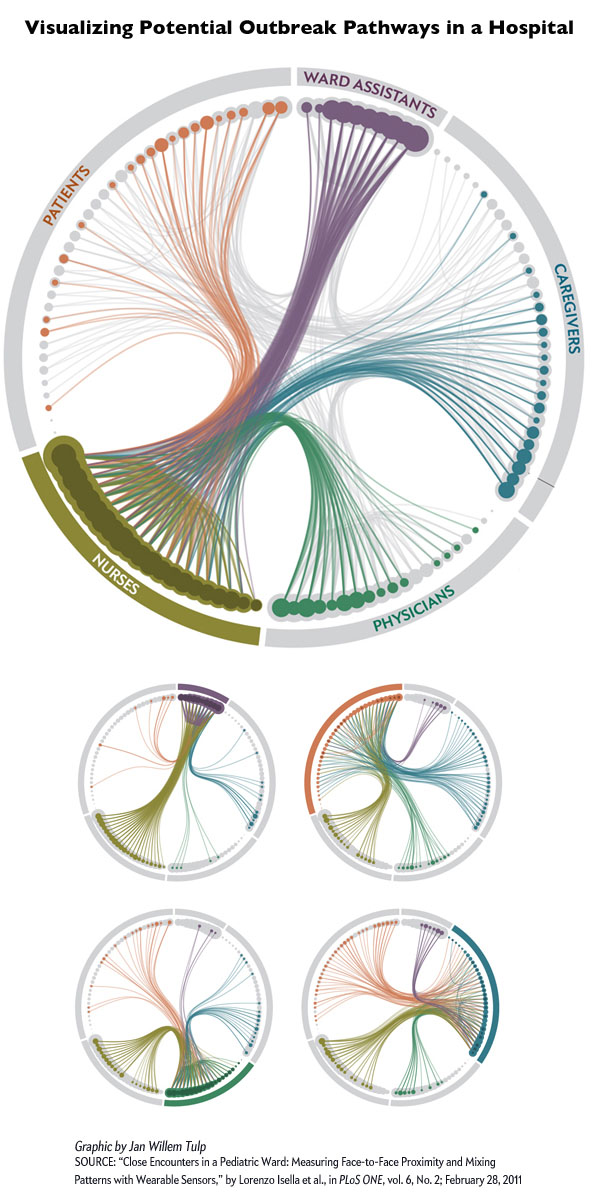
Visualization of outbreak pathways in a hospital
Visualization of outbreak pathways in a hospital | Scientific American, Graphic by Jan Willem Tulp

What works

Using RFID tags worn by hospital staff and patients at the Bambino Ges&#uacute; pediatric hospital in Rome, researchers with the SocioPatterns group tracked interaction patterns to help understand how nosocomial illnesses spread. Nosocomial infections are infections patients and hospital staff contract while they are in the hospital. According to wikipedia, about 10% of patients in hospitals in the US contract some kind of nosocomial infection every year; the most common infection is the urinary tract infection (36%).

The RFID tags were distributed to 119 individuals to tally up each person’s encounters with anyone who came within 1.5 meters for a minute or more. Of course, this generated a great deal of data. The graphic above does a good job of condensing the data into a single image – well, actually, there is one image for each category of person in the hospital and it is important to look at all five images for full analytical impact. Click on the graphic to go to Scientific American and see them all.

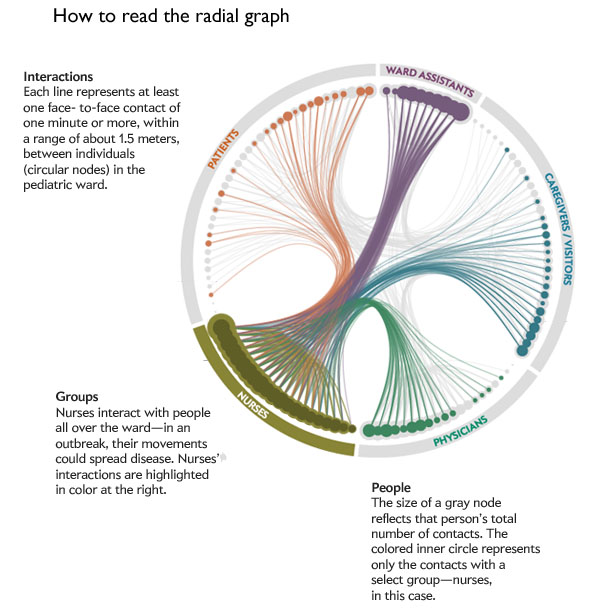
Legend for reading the radial graph of outbreak pathways in a hospital
Legend for reading the radial graph of outbreak pathways in a hospital | Scientific American, Jan Willem Tulp [graphic]

Somewhat unsurprisingly, nurses proved to be the most well-connected people in the hospital. They interact frequently with each other and with every other category of person: patients, ward assistants, doctors, and care givers. Even though I said this finding was “unsurprising” it is extremely important to have solid data supporting what seem to be obvious findings. For instance, imagine you had not read the previous paragraphs or looked at the graphics and I had written: “Unsurprisingly, doctors proved to be the most well-connected people in the hospital, interacting frequently with patients, care givers, nurses, and ward assistants”. It sounds almost as logical as what I wrote about nurses (quite frankly, I would have found it hard to believe that doctors interact frequently with ward assistants). The point is, before data exists, it is easy to convince ourselves that a variety of different logical scenarios are playing out. The RFID methodology was a wise choice because it did not rely on self-reports. Self-reports are tough because they ask responders to remember all their contacts AND to be unbiased about reporting them. Some encounters in hospitals are more valued than others. Contacts with patients are valuable because patient care is the manifest purpose of a hospital and would thus be more likely to be reported than, say, standing next to another nurse at the bathroom sink or urinal for a minute.

What needs work

Radial graphs, to me, are difficult to read. The science of networks is still what I would call an emerging field in the sense that both the methodologies and the techniques for analyzing data are not yet fixed. New strategies are still being developed at a relatively rapid rate. I think there might be a better way to present the data than the above radial graph, but the radial graph is a huge step ahead of the messy network nests that used to dominate the presentations/analysis of network research.

Messy nest network visualization
Nest visualization technique. Even with the colors it’s hard to make sense of the cluster on the left.

Here’s where I am having a hard time making sense of the radial graph. First of all, I didn’t get the immediate impression that nurses were the network hubs holding this whole situation together. I had to click through each of the five graphics twice to ‘see’ the finding that nurses are more well-connected than others in the network. Even then, it would have been relatively easy to make a mistake and think that ward assistants were just about equally important (and maybe they are!) because the dots representing their total contacts are just as large and somewhat more tightly clustered than the dots representing the nurses total contacts. However, the size of the dots records only total contacts and it seems that ward assistants have a great deal of contacts with each other (perhaps they work in teams?), but relatively little contact with patients or physicians. But the lines representing that data are faint compared to the weight of the dots making that part of the data analysis seem secondary, which is not the case.

I don’t have a great solution to the radial graph visualization of networks situation. To me, it seems like it is a huge step beyond the messy nests that used to be the go-to for network visualization but not yet fully baked as the gold standard.

References

Matson, John. (November 2012) RFID tags track possible outbreak pathways in the hospital Scientific American.
Note: The official date on the above source is 15 November 2012 but since it is only 4 November 2012, I left the day out of the date field.

Graphic by Jan Willem Tulp; Source: “Close Encounters in a Pediatric Ward: Measuring Face-to-Face Proximity and Mixing Patterns with Wearable Sensors,” by Lorenzo Isella et al., in PLoS ONE, vol. 6, No. 2, article e17144; 2011

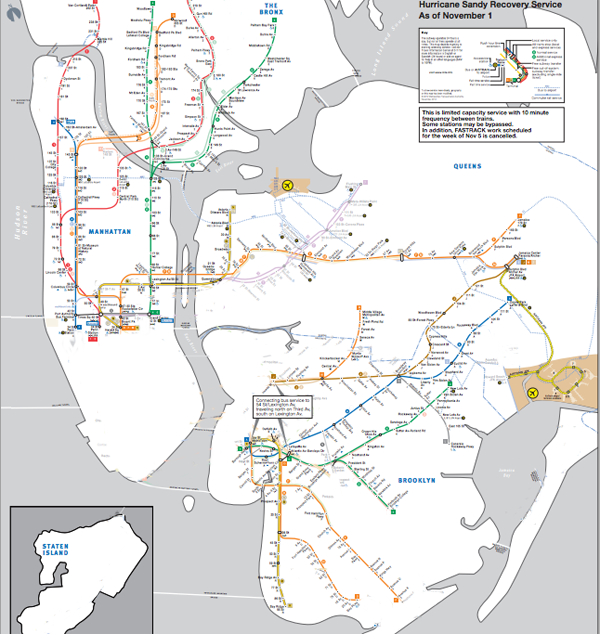
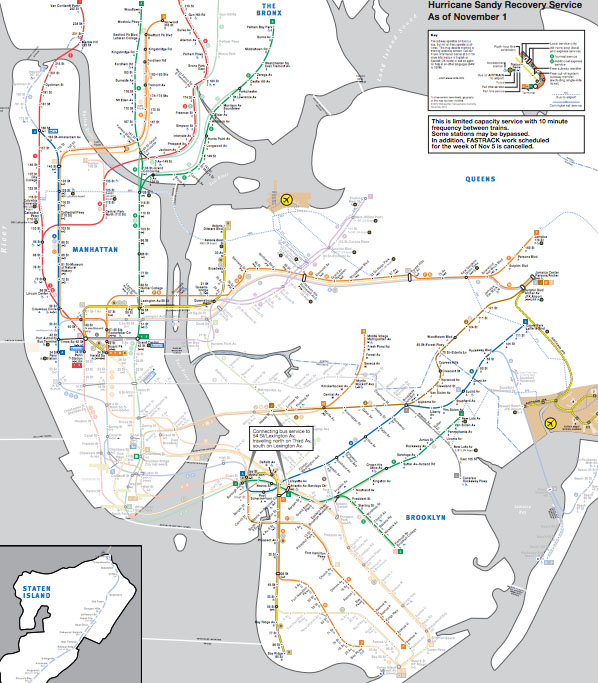
New York City subway map after Sandy

New York City subway map, Hurricane Sandy hangover map

New York City ghosted lines subway map

New York City subway map
New York City subway map with all of the lines ghosted in

Not back to normal

For those of you living in New York, the subway map is probably familiar to you. For those who are not here, but are listening to reports, I thought I would post the maps to illustrate that the subways are not back to normal. The national broadcasts I listen to keep mentioning that the subways are coming back, which is true, but Sandy essentially knocked the center out of the network. What was once one network is now two networks with very strange structures. They connect, if at all, not through their abdomens like spiders’ legs, but at the very ends of their extremities and there is no recognizable abdomen.

The storm also knocked out some specific edges of the network, like the end of the A train that ran past JFK and into the Rockaways. Note to travelers: The New York City subway is no longer connected to JFK airport.

As of this morning, I am hearing different reports about the 7 train in Queens. It might be running to the connection with the F train according to WNYC, but the mta.info website does not yet reflect that change. I left the line partially ghosted in. There are no reports that the 7 train is running all the way into Manhattan.

Brooklyn

There is subway service between Queens and Manhattan but Brooklyn has been cut off almost completely.

CNN's interactive racial voting bloc calculator
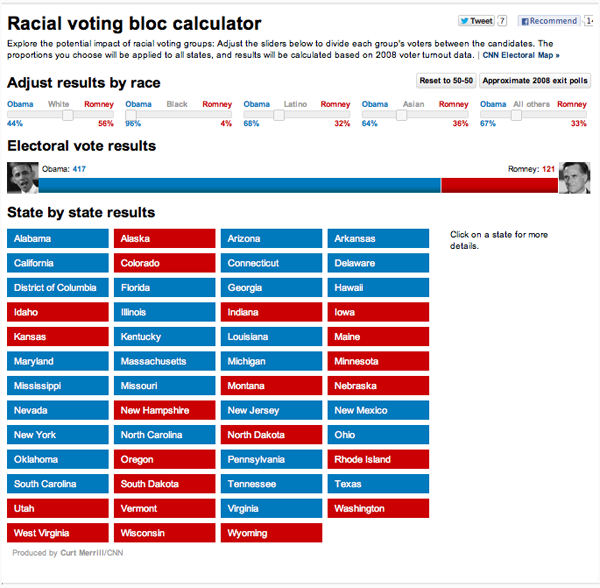
Screen capture of CNN’s interactive racial voting bloc calculator [Warning: the information in this image is misleading]

CNN’s Racial Voting Bloc Calculator is a perfect vehicle for demonstrating how to critically evaluate interactive graphical displays of data and 2) how ideological assumptions can be embedded in and reified by data, graphics and data analysis tools.

The calculator is designed to show how different patterns of racial voting might affect the upcoming election. At the top of the page five slider bars allow the user to set the level of White, Black. Latino, Asian and “Other” support for each candidate. So one can look at electoral college outcomes if say 56% of Whites, 10% of Blacks and 50% of everyone else votes for Romney.

The problem with this approach is that racial voting blocs don’t exist in the way this tool presents them. There are three ways to demonstrate this using data from the calculator and its associated data.

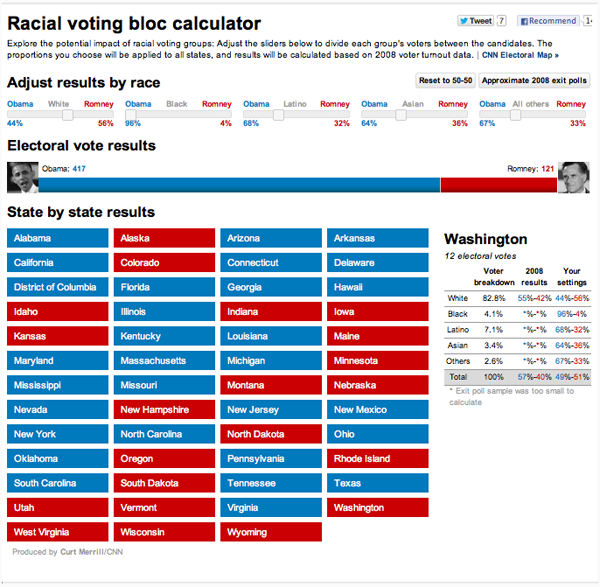
1) We can observe the absence of racial voting blocks directly by looking closely at the secondary data provided by the calculator. If you click on one of the state buttons a table appears at the right which lists (among other things) the vote by race for that state in 2008 based on exit poll data. The Washington state data look like this:

CNN's interactive racial voting bloc calculator for Washington
CNN’s interactive racial voting bloc calculator for Washington

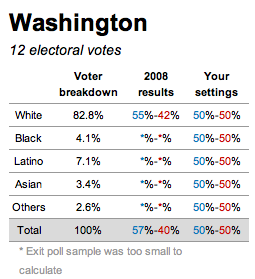
Close up of the important chart:

cnn-racial-voting-bloc-WA-closeup
CNN racial voting bloc, close-up on Washington state information

The “2008 results” column shows that in 2008 55% of white voters in Washington state voted for Obama. If you look at every state, you will find that the proportion of whites that voted for Obama varied from 10% in Alabama to 86% in the District of Columbia and 70% in Hawaii. Even if we exclude the most extreme cases the middle thirty states range from 33% (Idaho and Alaska) to 53% (Minnesota and Delaware). This is nothing like the cross state racial uniformity imposed by the calculator. The implicit assumption of the racial bloc voting calculator is that racial proportions are consistent across states and this is clearly untrue.

2) The data imply that race is not very important in elections. Look again at the table for Washington and note the absence of data for Blacks, Latinos, Asians, or “Others” in 2008 despite the fact that these groups make up 17% of the Washington electorate. Washington is not unique, missing data are endemic in these results. Data for Asians and Others are missing for 48 states, data for Latinos are missing in 37 states and for Blacks in 22 states.

The great French sociologist Pierre Bourdieu once wrote that missing data are often the most important data. That is surely the case here. Media organizations spend vast sums to collect poll data on the electorate. If race isn’t important enough for data collection, then it probably isn’t very important for understanding elections. There is a general lesson here, the presence or absence of data is often an independent indicator of importance.

3) It is also possible to use the calculator to make an argument by contradiction. That is, by demonstrating that the calculator gives nonsensical results under sensible assumptions. One of the calculator’s default options is to use “approximate 2008 polls.” In this case, Obama wins with 417 electoral votes which is more than he actually won in 2008. Also interesting are the state level results under this baseline scenario. Assuming bloc voting at 2008 levels causes changes in the electoral outcomes of 23 states. Even more interesting are the specific states that change their colors. Under the kind of bloc voting that the CNN calculator allows, the south becomes very strong for Obama, who would win Alabama, Mississippi, Georgia, and Louisiana with more than 60% of the vote in each of those states. In fact, these were among the weakest states for Obama, which again, implies that bloc voting is not occurring. So, if bloc voting existed 2008 election results would have been radically different from the actual results which implies that bloc voting does not exist.

Does this mean that race does not affect politics or that political appeals to race never work? No. It means that appeals to race work – when they work at all – from a baseline that varies from place to place. A far more interesting tool would allow for increasing the vote of a particular racial group from its preexisting state baseline. With this imaginary tool, one could add some percentage of the vote to a candidate in each state without forcing racial uniformity across states. For example, if we added 5% of the White vote for Romney the white vote would rise from 88% to 93% in Alabama and from 42% to 47% in Washington.

As constituted, the racial voting bloc calculator is useless for thinking about actually existing American politics. It is useful for encouraging caste based racial fantasies. And so it is no surprise that as I write this, the top google result for the words racial voting bloc calculator link to discussion forums at the white supremacist website stormfront.org.

One such fantasy might involve setting support for Mitt Romney to 100% among whites and 0% among Blacks Latinos Asians and Others. This produces a Romney landslide with Obama collecting only 7 electoral votes. The difference between this hypothetical and reality tells me that racial voting blocs do not exist. What it tells the stormfront.org discussion participant, FunktionMann, who ran the same “simulation” is that:

We need to clean house. ALL of our problems in this nation have been delivered to us by white traitors. Until we have identified, villified and run them out of business, we will not make any progress.

I began this post saying that we would see how to critically evaluate graphic data tools and see how ideology is embedded in those tools. The racial ideology embedded in the calculator isn’t the supremacist ideology of stormfront but it is a racial essentialism that assumes and privileges racial identity while inscribing race into our understanding of politics in ways that make no sense if we but take a moment to consider them closely.

*Alec Campbell is a Visiting Associate Professor of Sociology at Reed College in Portland, Oregon. He blogs at Follow the Numbers where this post was originally published.

References

Campbell, Alec. (2012) “Racial voting bloc calculator fact or fiction” at Follow the numbers and reposted here with permission.

Merrill, Curt. (2012) CNN racial voting bloc calculator cnn.com

Congressional demographics
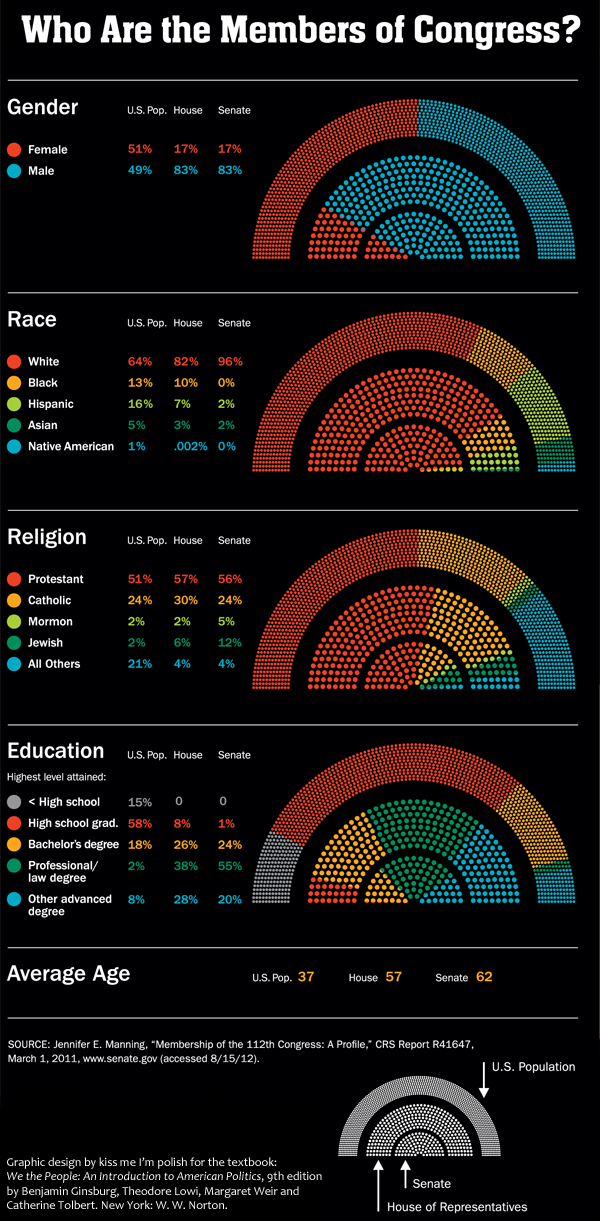
Congressional demographics | “Who are the members of Congress?” graphic by Kiss Me I’m Polish from the textbook “We the people: An introduction to American politics” by Ginsberg, Lowi, Weir, and Tolbert.

What works: Big picture

In the midst of election season, it can be easy to lose sight of the forest because we’re so entranced by the trees (or the leaves, for that matter). This graphic was developed by the design firm kiss me i’m polish in partnership with W. W. Norton and the authors of “We the People” to help students think through what it means to live in a representative democracy. The biggest outer arch of the rainbow depicts the breakdown of the total US population. So, for instance, we are split 50/50 when it comes to gender and just slightly less than half of us are Protestant. Then the middle arch illustrates how the 435 members of the House are divided and the smallest inner arch does the same thing for the 100 members of the Senate. It’s a great way to keep students thinking about not only the members of Congress but also about how that membership compares to the population they are supposed to represent.

The graphic lead me to wonder how it is that we come to collectively held opinions about what kind of parity is important. Gender parity – having about the same percentage of women in the House and Senate as we do in the general population – is a worthy goal. But age parity and educational parity are murkier. Legally, there are age minimums for serving in the House and Senate so we are never going to have age parity. I tend to agree with the founding folks who believed that wisdom and age have a measurable positive correlation, though I would probably argue that age is simply a fairly reliable proxy for experience. A young person with a great deal of life experience might be considerably wiser than an older person with very little life experience.

It would be easy enough to argue that we should also elect more well-educated people and feel like we are making a sensible choice as we do so. Right? More well-educated people have taken up lots of the facts and ideas circulating in a given time and place so education is probably a good thing for representatives to have. But education is correlated with class. Electing people who are overwhelmingly more well-educated also tends to mean we elect higher class folks. Of course, this is not a perfect relationship and it matters only if we think that class and political behavior are related. And, well, they are, but not in entirely linear ways, especially if education is our only proxy variable for class.

The main concern of this particular post is to show you a graphic that does an excellent job of raising fairly complicated questions without simultaneously implying answers. I am not going to push closer to any answers about how to understand the meaning of parity between individuals and their elected representatives is something we’d like to see in our representative democracy.

What works: Specific details

Color: The use of color here – especially for race – overcomes the typical tendency to try to use pink for women and maybe something dark brown for African American people. Yeah, both of those choices may make sense in some contexts, but unless there is a great justification for reinforcing stereotypes, buck stereotypes.

Fan + rainbow shape: The fan + rainbow shape is striking from a distance and allows for both segments and stripes. It offers more visual vectors for categories than I would have imagined. I probably would have gotten hung up thinking only about the stripes in rainbows and forgotten that the rainbow shape is also like a fan, and fans have segments.

Rainbow and Fan

Numbers are not layered over the graphic: The graphics stand on their own and the numbers are presented directly adjacent to them in small tables. This is a best-of-both-worlds approach that displays the actual numbers accompanying the impressionistic visualization of the data without having to deal with the clutter of seeing the numbers layered over or arrowing into the data which messes up the visual comparison task and also makes the numbers harder to read.

What I would have liked…

The age variable is listed as averages here, nothing visual. That’s fine, but whether or not the information is displayed just as a mean or it is developed as a graphic similar to the others, it would have been nice to be reminded that Senators have to be at least 30 and Representatives have to be at least 25 years old. This is a relevant contextual touch, helping to remind the (young) students that there are slightly different elements structuring the age disparity. Some of the extremely astute students might have been reminded that the racial category used to have a similar asterisk pointing to the role of law in politics.

References

(2012) “Who are the members of Congress?” [infographic] by kiss me i’m polish. New York.

Ginsberg, Benjamin; Lowi, Theodore; Weir, Margaret; and Tolbert, Caroline. (2012) We the people: An introduction to American politics, 9th edition. New York: W. W. Norton.
[Note: The link here goes to the web page for the 8th edition of this book but the graphic was taken from the 9th edition. A similar graphic was included in the 8th edition. The 9th edition image above includes updates that reflect the results of elections that have happened since the 8th edition was published but the overall look-feel and the design concept remained the same.]

What has been working?

Graphic Sociology is one of a growing number of blogs that feature and critique information graphics and I’m glad to be part of this group. I’m glad that since there are so many of us, each one can specialize a bit. With this back-to-school season, Graphic Sociology is going to graduate and move into a more analytical, less repetitive direction with fewer reposts, more original content, and more macro-level analysis rather than micro-level critiques of particular graphics. If you love the old format, go ahead and look through past posts. Or better, browse through the list of links in my blogroll. There are plenty of other blogs, often updated more frequently than Graphic Sociology, where you can gaze upon graphics for hours and hours.

So what are the changes?

1) graphics will be tilt towards original work by me (or others – nominate your own work!) with fewer reposts of graphics found around the interwebs,
2) reposts will show modifications rather than just tell about opportunities for modifications and describe how and why graphics come to be as they are,
3) I will tweet and pin graphics I like (@digital_flaneus at pinterest) for those who enjoy having a stream of graphics wash over their visual cortex,
4) each month I will review an information graphics how-to or theory-based book (see below for the initial list of books),
5) new textbooks and related online content in the social sciences will occasionally be reviewed with an eye towards assessing their information graphics content.

Every one of these changes is a change that will require more time and commitment on my part. Because I haven’t suddenly found more hours in the day, this means there will be fewer posts on the blog, but the posts that appear will be deeper, more engaging and thought-provoking. My twitter and pinterest infographics board will serve to stream interesting graphics for those who want more volume.

Which books will be reviewed?

These are all books that offer thoughtful perspectives on how to create or how to understand information graphics.

1. Tufte, Edward. “The Visual Display of Quantitative Information” and “Envisioning Information” [September]
2. Yau, Nathan. “Visualize this: The flowingdata guide to design, visualization, and statistics” [October]
3. Grafton and Rosenberg. “Cartographies of Time: A history of the timeline” [November]
4. Few, Stephen. “Now you see it: Simple visualization techniques for quantitative analysis” and “Show me the numbers: Designing tables and graphs to enlighten” [December]
5. Ware, Colin. “Information Visualization: Perception for design, 3rd edition” [January]
6. Steele and Iliinsky “Beautiful Visualization” and Segaran and Hammerbacher “Beautiful Data” both published by O’Reilly [February]
7. Wong, Dona “Wall Street Journal Guide to Information Graphics” [March]
8. Cleveland, William “Visualizing data” and “The elements of graphing data” [April]
9. Up for grabs

I’m also planning to review textbooks in the social sciences from the perspective of the pedagogical usefulness of their graphic elements both in the books and in their online supplements, where available. I am still building my list for this but it will include Dalton Conley’s “You May Ask Yourself: An introduction to thinking like a sociologist, 3rd edition” and “We the people: An introduction to American politics”. I’m also looking for a good title in Social Psychology and one in Economics. Feel free to send along nominations.

Summary

Graphic Sociology will focus more intently on the intersection of information graphic design and social sciences. It will have more original graphical content. It will also develop an ambition to become a resource for teachers looking to choose textbooks with high quality information graphics and for social scientists who want to be able to quickly understand which books are worth buying if they want to get into creating information graphics in their own research.

Follow me on twitter and/or pinterest if you want to see a volume of infographics. I have found I can share many more graphics I like that way.

If there are other changes folks would like to see or changes that already rub the wrong way, please leave me a comment. That’s the beauty of web 2.0. Readers can talk back.

Graphic: Gender ratio of recent US graduates by degree
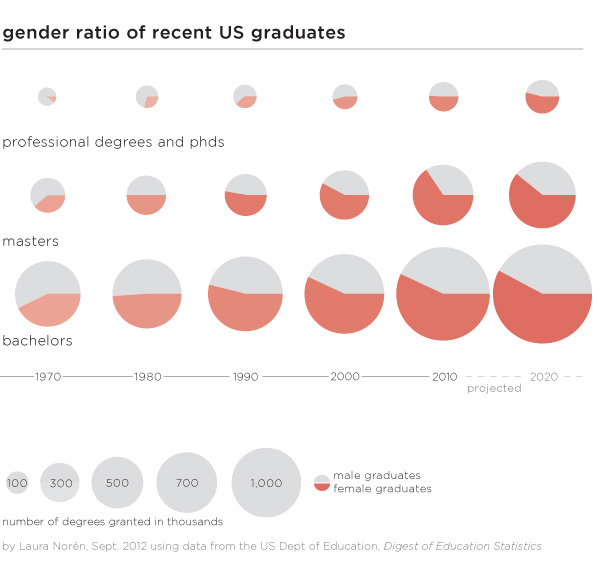
Gender ratio of recent US graduates by degree | Laura Norén | click caption for pdf

Is higher education “dominated” by women?

There has been plenty of news coverage recently about the rise of women and the decline of men. While I have always disliked the irrational use of zero-sum language – why do we have to frame this discussion as men who are losing because women are making some gains? – I thought it would be worth taking a closer look at the gender ratio in higher education. I found many text-heavy stories (the Guardian, the New York Times, the Chronicle of Higher Ed, Huffington Post, The Atlantic, and many others) about female students earning more bachelors but surprisingly few graphics.

Graphics can do an excellent job of summarizing the gender gaps as they have developed over time within bachelors, masters, and professional+doctoral degrees. One graphic, quite thought provoking. All of the three degrees were more likely to be earned by men in 1970. Then between 1970 and 1980 women made rapid gains which continued through the 1980s. The gains for women slowed down once they hit the 50/50 mark for both bachelors and masters degrees and I predict they will also slow down for phd and professional degrees. Though it’s hard to tell by looking at the graphic, women are earning the largest proportion of masters degrees (projected to be 61% in 2020) which is slightly more than the 58% of bachelors degrees they are projected to earn in 2020.

Why aren’t women earning more if they are so well educated?

There is still a pay gap in earnings between men and women. Within the university, male faculty members tend to make slightly more than female faculty members. Overall, the most powerful explanation for pay gaps is not so much a failure to pay men and women equally for the same job. Rather, women are more likely to get degrees that lead to positions which are paid less than the positions men are more likely to get following their collegiate specializations. More women end up in education and nursing; more men end up in engineering and computer science. Education and nursing are not as likely to be lucrative as jobs that require engineering and computer science degrees.

To answer the question about women “dominating” higher education it is clear from the numbers that there are more female students at every level, though some majors still tilt towards men. What’s perhaps more important, women may or may not go on to match the earning potential of men, in part because they may not always choose the majors that lead to the most lucrative careers. Some argue that earning potential should drive choice-of-major but I’m still of the mind that going to school is not all about (or even primarily about) producing good workers. Going to school is about taking the time to explore different ways of thinking in depth and without undue concern for their ability to produce economic return. I’m glad that we have gotten to the point where there is enough gender parity to return to conversations about what school is for rather than who school is for…

Does the gender gap in graduation rates vary by race/ethnicity?

Graphic: 2009 US bachelors degrees by race/ethnicity and gender
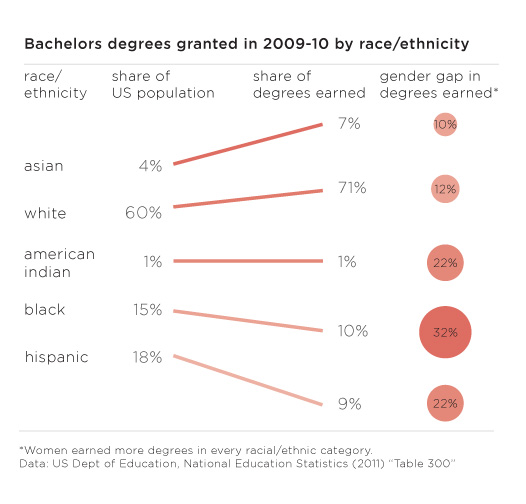
2009 US bachelors degrees and gender gaps by race/ethnicity | Laura Norén | click caption for pdf

…but on the other hand, there are still critical gaps in access to higher education and degree completion that trend along racial/ethnic lines (class lines, too, but I didn’t get into that in this post). The graphic above displays the share of bachelors going to different racial/ethnic groups in 2009. In order to provide a relevant framework for comparison, I plotted the share of degrees earned next to the share of the total population of 18-24 year olds constituted by each racial group. There are some missing categories – mixed race people, for instance – but I couldn’t find graduation rates broken down any further than the five traditional racial/ethnic categories. Asians and Pacific Islanders only make up 4% of the population but they earn 7% of the bachelors in 2009 and their gender gap that year was only 10%. Whites were similarly over-represented in degree-earners and had a similar gender gap of 12%. But then things got interesting. The gender gaps for American Indians and Hispanics were much higher at 22% and the gender gap for blacks/African Americans was even higher still at 32%.

Especially when it comes to studying gender which is often constructed as a binary in which both groups make up about 50% of the whole, it is important to realize that analytical rigor might be increased by further segmenting these gender categories by some other key analytical variable. In this case, adding vectors for race/ethnicity provided a new perspective, one that might be a decent proxy for class.

References

Norén, Laura. (4 September 2012) Gender ratio of recent US graduates [infographic] New York.

Norén, Laura. (4 September 2012) US bachelors degrees by race/ethnicity [infographic] New York.

National Center for Education Statistics. (2011) Table 283: Degrees conferred by degree-granting institutions, by level of degree and sex of student: Selected years, 1869-70 through 2020-21 [Available in html and xls] US Department of Education.

National Center for Education Statistics. (2011) Table 300: Bachelor’s degrees conferred by degree-granting institutions, by race/ethnicity and sex of student: Selected years, 1976-77 through 2009-10 US Department of Education.

US Census Bureau. (2012) Table 10: Resident Population by Race, Hispanic Origin, and Age: 2000 and 2009 In The 2012 US Statistical Abstract. [Available in pdf and xls.

Expert commentators on women's issues in American media | 4thEstate.net
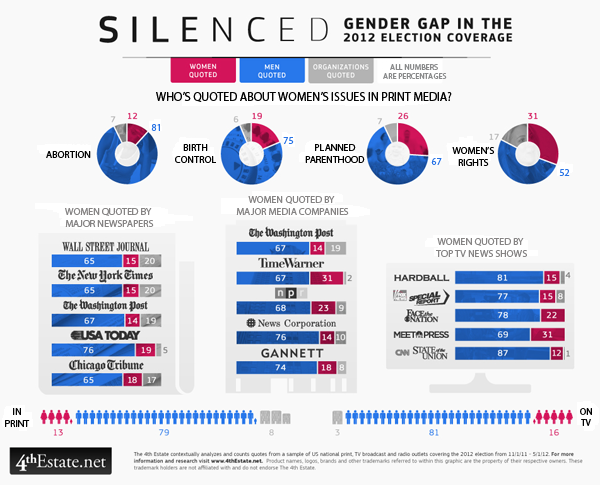
Expert commentators on women’s issues in American media | 4thEstate.net

What works

Election coverage dominates the American media in the months before any presidential election and the group (of unnamed people) over at the 4thestate.net are covering the coverage of the election. They tend to share their findings as graphics. The graphic above came from a special report on gender that looked at the gender of the experts who are called upon to comment on women’s issues like abortion, birth control, planned parenthood, and women’s rights. I can already tell that the first criticism is going to be that these issues are not just women’s issues. Fair enough. The point that they are trying to make, though, is that even in a media system that some say has a “liberal bias” women are significantly under-represented as expert voices. Or any kind of voices.

The graphic does a good job of showing THREE categories of commentators – men, women, and institutions.

In terms of color, the graphic resorts to a men-are-blue, women-are-red division which is fairly stereotypical. I am glad that women are not pink (see this post for an example of what happens when light blue and pink are used to represent gender). While I feel a lot of pressure to escape traditional gender binaries, in graphic design, harnessing people’s existing stereotypes is often a powerful way to make an instant impression. So while these designers could have used any two colors to represent men and women – purple and yellow, orange and green, teal and chartreuse – the fact that they leveraged the underlying American stereotypes associated with the gendering of colors gave them a way to tie together different graphical elements into one infographic. Personally, it does not bother me that women are represented as red and men are represented as blue, even if it is stereotypical. Some stereotypes hurt; this isn’t one of them as far as I am concerned. Pastel colors like light blue and light pink tend to infantilize the appearance of presumably adult behaviors and I would avoid using those to represent adults. But the red and blue used here are plenty grown up. Feel free to scold me about gender stereotypes in the comments if you disagree.

What needs work

Graphical donut - Women quoted in print media in 2012 election coverage on abortion
Graphical donut – Women quoted in print media in 2012 election coverage on abortion

I am on the fence about the donuts. Would the donut be easier to read as a bar graph? Perhaps. But turning the circle form into a bar form would eliminate a good deal of the natural division in the graphic between print media – all donuts – and specific media outlets – collections of bar graphs. Right now, without even bothering to read the titles, I can tell that the donuts are all comparable to one another but not necessarily directly comparable to the other elements of the graphic. This prompts me to read the titles to figure out how I ought to be making comparisons between the graphic elements. If the donuts were straightened out into bar graphs, I’m not sure I would instantly sense that they were unlike the rest of the graphic because they would look the same even if they had different titles. The graphical forms should emphasize the text of the headings and the designers here got that right.

My question about what needs work is that I am not sure any comparisons between donuts and bar graphs are easy to make because it seems like some members of the 4th estate team wanted to see the data broken down by issue, others wanted to see it broken down by specific publication, and instead of choosing one or the other, they compromised and showed both. Rather than thinking of this as a comparison issue, I guess I will think of it as simply two different sets of data that both deal with the question of how women are denied roles as expert commenters when it comes to women’s issues.

Acknowledgements

Thanks to Letta Wren Page for sending me the graphic and to the 4thestate for their decidedly graphic coverage of the 2012 election.

References

4th Estate. (2012) Silenced: Gender gap in 2012 election coverage [infographic] 4thestate.net

US food security map | Gallup via Marketplace.org

What works

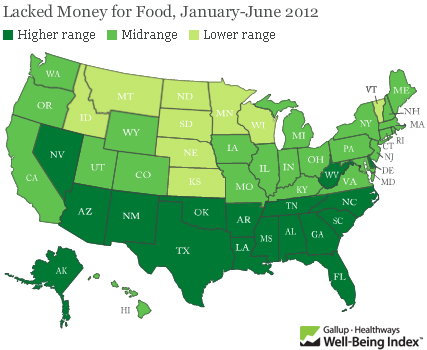
Food insecurity – worrying about having enough money to buy food – is an extremely important problem. Gallup came up with new poll numbers on the prevalence of food insecurity in the US just this week and spokesman Frank Newport did an interview on the findings with Tess Vigeland of the radio show Marketplace. Marketplace ran the map graphic above on their website which is somewhat rare for a radio program given that graphics just do not have much of a place on the radio.

The survey question was:

Has there been one time in the last 12 months when you did not have enough money to buy the food that you or your family need? And overall, 18 percent of Americans so far this year — the first half of the year — said yes, there has been at least one time.

The graphic makes clear that the problem of food insecurity has a north-south pattern to it. People in the South have “high” levels of reporting food insecurity while people in the middle and on the west coast have “moderate” levels of food insecurity and folks in the north have “low” levels of food insecurity. But…

What needs work

…where are the numbers? What ranges are represented by the “low”, “medium”, and “high” levels of reported food insecurity? This information should be in the graphic. Legends matter.

What we can imply from the interview is that the states in the “high” range have 20% of their poll respondents reporting that they’ve had trouble paying for the food they need in the last 12 months. The “low” level of insecurity includes states like North Dakota where 10% of people reported having trouble paying for food. That still seems high given how wealthy Americans are on the whole. This food insecurity data is one way to think about just how economic inequality plays out in the US. Folks cannot even afford the food they need.

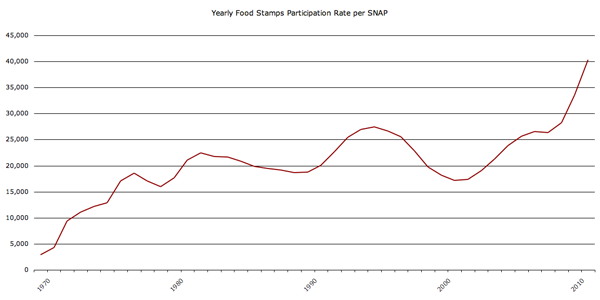
Here’s another graphic to think about, the rate of the use of food stamps (SNAP):

Food stamp program participation 1970-2010
Food Stamp program participation 1970-2010

Understanding food insecurity is one of those things that is going to require more than a single map based on a single survey question asked at one point in time. Well-designed graphics can and should aim to depict complexity and nuance…kind of like any other representation of critical analysis (writing, reporting, etc).

References

Vigeland, Tess. (23 August 2012) Americans struggle to feed their families. [Interview with Frank Newport] marketplace.org

Global charitable giving

Global charitable giving map, 2011
Global charitable giving map, 2011 | Charities Aid Foundation

How much do people give?

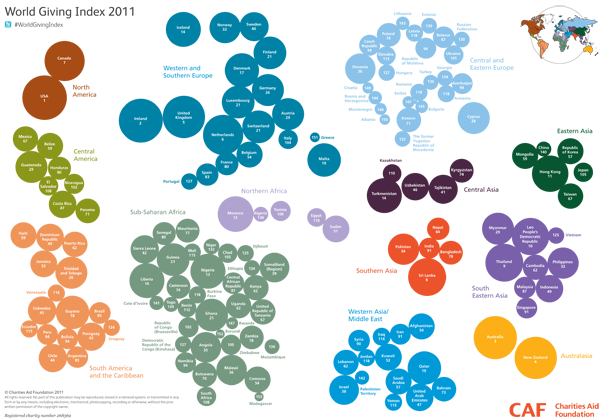
Globally, there are some major differences in giving rates on a national basis. The Charitable Aid Foundation conducts and annual global poll that asks about giving money, giving time, and helping individual strangers. The 2011 report notes that when it comes to predicting which countries have the most generous citizens:

The countries whose populations are the most likely to give are not necessarily the world’s most affluent. Only five of the countries that feature in the World Bank’s top 20 by GDP (PPP) per capita feature in CAF’s World Giving Index top 20.

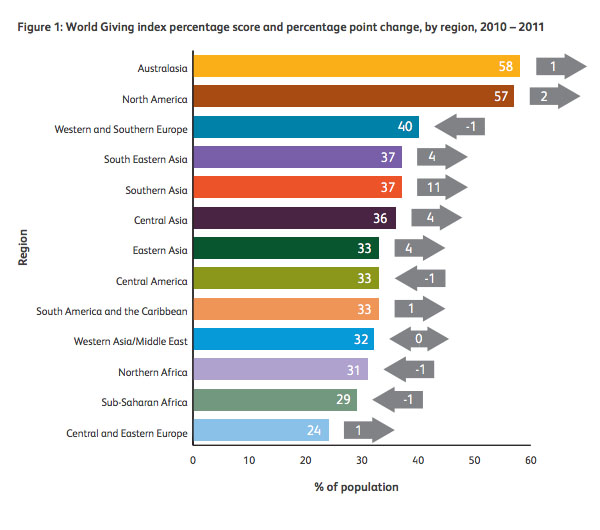
World Giving Index by World Region
World Giving Index by World Region, Charities Aid Foundation

The US moved from 5th place in 2010 to 1st place in 2011 with increases in the number of people donating time, money, and aid to individual strangers. I guess we respond to the economic crisis by donating to specific people and causes while demanding lower taxes? Anyone else want to try to interpret that?

As for the graphic, I wish there were a key. I figured out eventually that the number inside the circle represents the country’s overall rank and that the size of the circle is proportional to per capita giving. I had to look at the graphic for a while to convince myself that the size of the circles was proportional to per capita rather than total giving per country. The one thing I like most is the inclusion of the small inset map in the upper right corner that helps relate the circles back to the map of the world that we are used to seeing.

But let’s take a look at giving in the US, since we are supposedly the top of the heap as of 2011.

US charitable giving

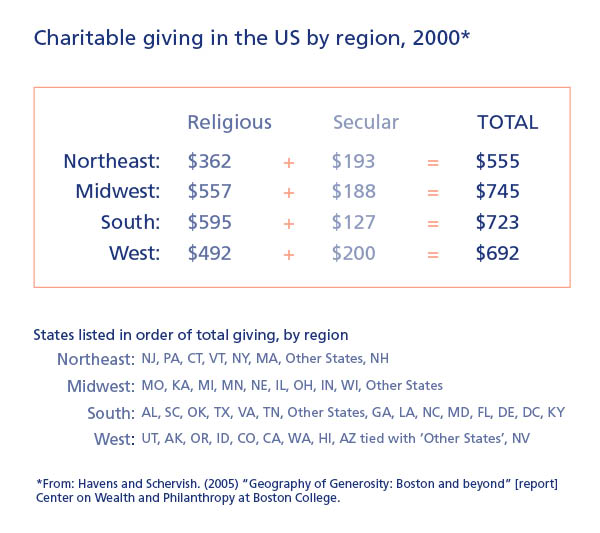
Charitable giving in the US by region, 2000

How much do Americans give?

Caveat: I was not able to find US data from 2011 so the bottom half of this blog and the top half are out of sync temporally. Also, the US study only looked at cash donations whereas the global index looks at donations of cash and time as well as helping behavior towards individual strangers.

Individual giving in America is divided between two general categories of giving – religious and secular. Many church members give cash and write checks to their churches either as part of tithing or in less formal donations to the offering plate when they get around to attending a service. Measures of religiosity in the US indicate that Americans are slowly becoming less religious over time. A WIN-Gallop poll of global religiosity came out on July 27th and showed that only 60% of Americans are regular churchgoers, down from 73% seven years ago. I wondered how that would impact charitable giving here in the US. Unfortunately, the only free data I could find was from 2000 which is well before the findings from the recent poll data. [Note: If you are extremely interested in charitable giving in the US there are quite a few reports available to those willing to pony up some cash at Giving USA.]

The table above is a summary of the state-level, individual cash donation activity of Americans in 2000 that was originally constructed by John Havens and Paul Schervish at Boston College’s Center on Wealth and Philanthropy. They used a slightly different methodology from the one used by the aforementioned Giving USA group that I found more compelling. Giving USA was looking at cash giving by examining the itemized deductions folks list on their annual income tax forms. However, many people (especially lower income people) do not itemize their deductions. Further complicating matters at the state level is the fact that some states have many more itemizers than others. Therefore, looking at itemizers in one state is very different than looking at itemizers in another state. In one state we might only capture fairly wealthy people. In other state, we might be looking at a much broader cross section of the population. Havens and Schervish not only tried to make sure they had comparable samples of people from each state, they also took into account costs of living in different states and weighted their totals based on the number of households in each state.

I summarized their major findings above. What frustrated my data visualization self the most was that I could not make a similar cartograph that would allow us to see the US the way we can see the globe in the cartograph at the top. Havens and Schervish pooled data for a number of states together – see where I have tried to list all the states in each of the regions? See how it says ‘Other States’ four different times? The explanation for this was that the sample size in some states was so small it had to be pooled in order to maintain the subjects’ anonymity. Fair enough. I just wish it were otherwise.

Are states within the same region similar when it comes to charitable giving? For the most part, no.

The midwest has no major outliers, high or low (at least, not that I can tell given that some states are lumped into that obscure “other states” category). The other three regions show wider dispersion. The west, for example, has the most generous state (Utah: $2632) but just next door is Nevada with a very low rate of giving (Nevada: $303). The south looks fairly generous on average, but that average obscures some dramatic differences. Two states pull up the average (Alabama: $1842 and South Carolina: $1243) and make up for the two of the least generous states which are also in the South (Kentucky: $218 and the District of Columbia: $273). With respect to DC, my hunch is that wealthy lawmakers and other multi-state residents buzzing around DC may be reporting all of their charitable giving on their tax forms for their “home” states. I cannot explain why Kentucky gives so little. Another notable miser of a state is New Hampshire (New Hampshire: $246). Shall we take a moment to ponder the implications of the “live free or die” ideology?

References

Charities Aid Foundation. (2011) World Giving Index [information graphic] Kent, UK.

Charities Aid Foundation. (2011) World Giving Index 2011. [Report]. Kent, UK.

Havens, John and Schervish, Paul. (2005, November) Geography and Generosity: Boston and Beyond [report] Boston: Center on Wealth and Philanthropy at Boston College. For convenience, I extracted the relevant table for download <a href="generosity-report-extract“>here.