What works
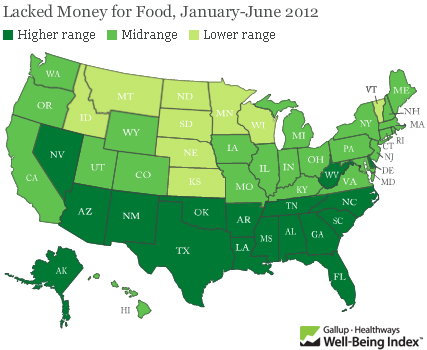
Food insecurity – worrying about having enough money to buy food – is an extremely important problem. Gallup came up with new poll numbers on the prevalence of food insecurity in the US just this week and spokesman Frank Newport did an interview on the findings with Tess Vigeland of the radio show Marketplace. Marketplace ran the map graphic above on their website which is somewhat rare for a radio program given that graphics just do not have much of a place on the radio.
The survey question was:
Has there been one time in the last 12 months when you did not have enough money to buy the food that you or your family need? And overall, 18 percent of Americans so far this year — the first half of the year — said yes, there has been at least one time.
The graphic makes clear that the problem of food insecurity has a north-south pattern to it. People in the South have “high” levels of reporting food insecurity while people in the middle and on the west coast have “moderate” levels of food insecurity and folks in the north have “low” levels of food insecurity. But…
What needs work
…where are the numbers? What ranges are represented by the “low”, “medium”, and “high” levels of reported food insecurity? This information should be in the graphic. Legends matter.
What we can imply from the interview is that the states in the “high” range have 20% of their poll respondents reporting that they’ve had trouble paying for the food they need in the last 12 months. The “low” level of insecurity includes states like North Dakota where 10% of people reported having trouble paying for food. That still seems high given how wealthy Americans are on the whole. This food insecurity data is one way to think about just how economic inequality plays out in the US. Folks cannot even afford the food they need.
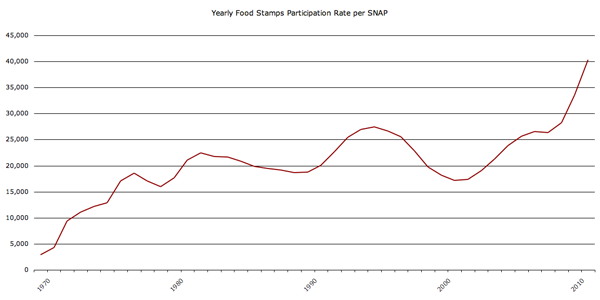
Here’s another graphic to think about, the rate of the use of food stamps (SNAP):

Understanding food insecurity is one of those things that is going to require more than a single map based on a single survey question asked at one point in time. Well-designed graphics can and should aim to depict complexity and nuance…kind of like any other representation of critical analysis (writing, reporting, etc).
References
Vigeland, Tess. (23 August 2012) Americans struggle to feed their families. [Interview with Frank Newport] marketplace.org
