Uncategorized

Food Pyramids, the backstory

The United States Department of Agriculture has been in the business of creating one particularly important information graphic: the food pyramid. This graphic has not always been a pyramid. Back in the 1980’s it was still a square made up of four equal sized squares. (Because the 1980’s were not digitized I have had a difficult time finding a representation of this early four-square diagram. The basic gist was that there was a dairy/milk/cheese group, a meat group, a fruit/vegetable group, and a beans/breads/starches group. I will look for this diagram and repost here when I finally find it.)

The USDA’s dietary recommendations are consequential. School lunches are crafted to comply with them, young children learn the ‘science’ of eating in school with the diagrams as a guide (presumably they would have already started learning the culture of eating at home), and the nutrition guidelines on food packaging are based on these recommendations as well. Marion Nestle’s work (Food Politics) exhaustively shows that these recommendations are often influenced by lobbying groups like the National Pork Producers Council, Archer Daniels Midland, Conagra, the National Dairy Council, and the National Cattleman’s Beef Association. That is not meant to be an exhaustive list or to point fingers, just to remind you that food is a business and like any other business, interested stakeholders go to Washington to lobby for themselves. So, for example, the dairy council is quite interested in suggesting that people should be getting 3 servings of dairy every day even though the majority of people over the age of five are at least mildly lactose intolerant. Furthermore, there is conflicting research evidence on the “milk builds strong bones” claim that often gets parents pouring glass after glass for their children. Calcium from milk may not, in fact, make bones any stronger. Regular exercise is a more reliable solution (along with good genes).

From a graphics perspective, then, there is a lot of summarizing that has to happen in the production of a definitive picture of a healthy diet. Like I mentioned, we started with a square made up of four squares. But that diagram emphasized foods relatively high in saturated fat — meat and dairy. Saturated fat was, and is, deemed to be bad for health. However, there was some debate at the time about whether or not the public would be able to tell the difference between saturated and unsaturated fat. They could get confused. They might eat the wrong things and avoid the right things. So, to simplify, it was easier to just promote a low fat diet all around and skip the distinction between saturated and unsaturated fats (see Walter Willett, Eat Drink and Be Healthy for more on this debate). After a fairly rigorous study, it has been deemed that low fat diets are not a panacea and do not lower risks of heart disease or cancer.

The food pyramid: Round I

The first food pyramid emphasized the consumption of starches above all else: 6-11 servings per day. No distinction was made between whole grains and processed grains that are less nutritious. Cereal and pasta are specifically listed in this group. Fruits and vegetables stack on top of this base, on top of them are protein sources – meat, dairy, nuts, legumes. At the very top is the eat “sparingly” category containing sugar and fats. It’s unclear just how often sparingly is. Nestle talks about how recommendation language is often massaged so that it seems no foods are bad as long as they are eaten in moderation. From a nutritional perspective, this is only half true. What’s the point of eating something that has no positive nutritional value and might come with negative side effects like tooth decay, weight gain, and worse? There is no point; those things should be avoided.

So why not just come out and tell people not to eat candy, soda, chips, cake and ice cream? Promoters of those particular food commodities don’t want the government telling people that ice cream is bad for us. They’d prefer that it be ‘eaten sparingly’. This is the difference between schools on the federal lunch plan serving ice cream once or twice a week or never at all. It’s a lot of money. Quite frankly, this pyramid’s cap is so vague – “fats naturally occurring and added” and “sugars” – that it would be hard to know how to follow this advice. Many foods are not primarily fat or sugar. Take, for example, a chocolate covered strawberry. Is that a fatty, sugary food to be avoided or a piece of nutritious fruit to be eaten for three servings a day? Frosted mini wheats? Good because of the fiber or bad because of the frosting? Sweetened packets of instant oatmeal? Good or bad? It’s much easier to tell what is in all the other categories of this graphic than the cap on top where all the fat and sugar are quarantined, somehow stripped out of the food products where they occur in real life.
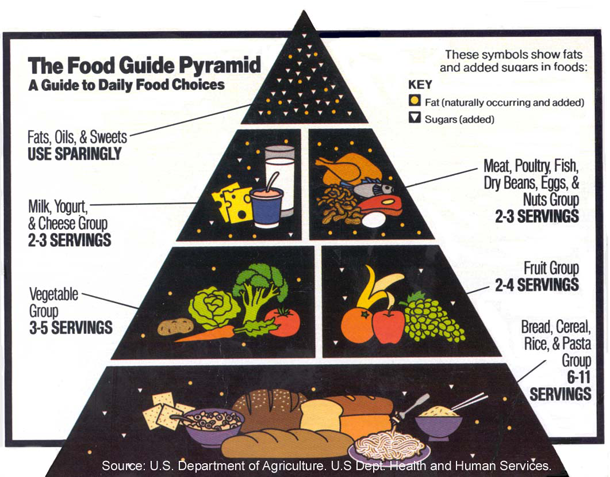
USDA Food Pyramid: 1995-2005

mypyramid.gov

For all it’s shortcomings, this pyramid was targeted for a redesign. Some were upset that it’s only in English, others that it seems to encourage people to eat too many carbohydrates (rates of obesity and diabetes have continued to rise even amidst a lower fat intake, see Nestle). People who view the world holistically wanted to see some mention of lifestyle – isn’t exercise part of the consumption cycle? In 2005, the pyramid below came out as an interactive graphic which you can play around with at mypyramid.gov.

mypyramid.gov static graphic from the USDA

As a stand alone graphic this is ridiculously awful. The one good thing it did was to have a stick figure running up the side, indicating that exercise is part of the program. The rest has almost no instructive value as a static graphic. If there were concerns before that some people wouldn’t be able to use the chart properly because they couldn’t read English, this chart has far greater problems to surmount. It can only be used in an interactive setting. The color coded bars aren’t even labeled, they all appear to be more or less even. So the idea it’s offering seems to be: eat everything in equal amounts and then go running. If you make it over to the mypyramid site you’ll see that it asks you questions about your height, weight and gender to help suggest a pyramid just for you. But the graphic gets left behind in the process in favor of tables.

Next?

For a project I was working on last summer, I took my own stab at redesigning the food pyramid by literally standing it on its head. Walter Willett’s book “Eat, Drink and Be Healthy” served as the nutritional guide. In addition to telling people what TO eat, the graphic tells people what NOT TO eat. Down at the bottom there is also a grey area representing foods in which the evidence has gone both ways. Some studies suggest that a glass of red wine every day is good but we also know that too much drinking is bad. And at least one study suggested that one daily serving of any alcoholic beverage was therapeutic, not just red wine. Vitamin supplements are another hot area with recent studies showing that they don’t do much.

I welcome comments on this particular pyramid.
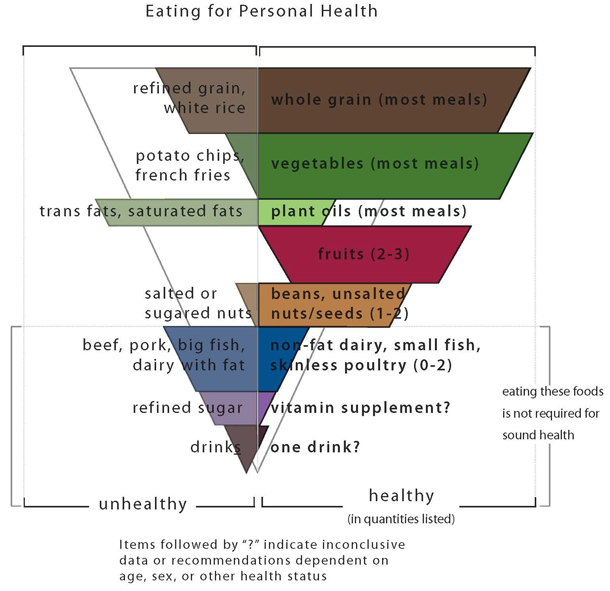
Based on data from Walter Willett's Eat Drink and Be Healthy

Relevant Resources

Kolata, Gina. (2006, 8 February) Low-Fat Diet Does Not Cut Health Risks, Study Finds The New York Times online.

Kolata, Gina. (1994, 14 April) Vitamin Supplements Are Seen As No Guard Against Diseases New York Times.

mypyramid.gov

Nestle, Marion. (2007) Food Politics: How the food industry influences nutrition and health, 2nd ed. Berkeley: University of California Press.

Parker-Pope, Tara. (2009, 16 February) Vitamin Pills: A False Hope? Well Blog: The New York Times online.

Rabin, R.C. (2009, June 15) Alcohol is good for you? Some scientists doubt it” New York Times online.

Willett WC. Eat, Drink, and Be Healthy. New York: Simon and Schuster, 2001.

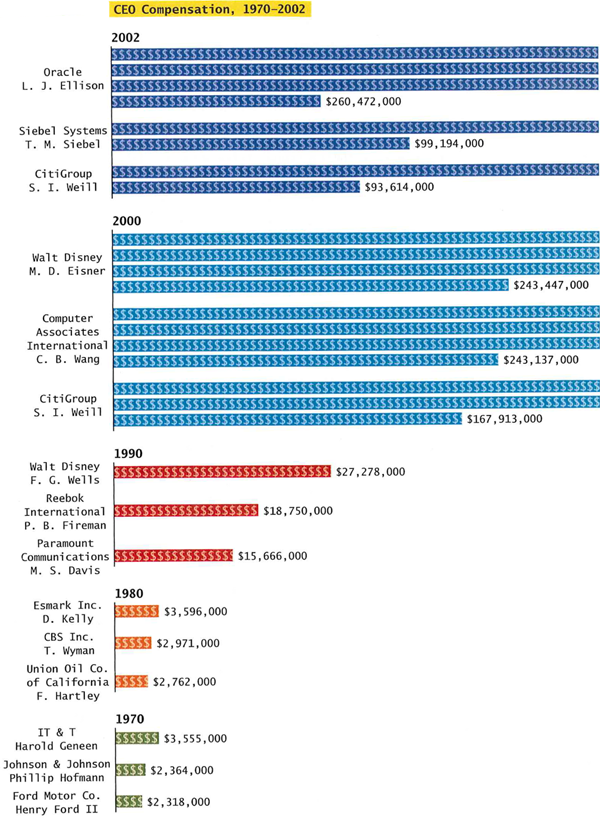
CEO Compensation 1970-2000 (Conley, D.)

What Works

This is a great concept because CEO compensation has ballooned relative to compensation for the rest of us.

What Needs Work

I would like to see some of the comparative data on compensation for the rest of the work force somehow, not just CEOs.

It would be nice for the graphic to say that the figures are all in year 2000 dollars.

Collapsing the bars instead of stringing them out diminishes the visual impact dramatically. If the highest compensation was displayed end-to-end instead of broken up and stacked it would look far more disparate compared to the 1970 compensation data. Now, realizing that this would skew the page layout, the graphic designer could have pursued a volumetric portrayal instead of just a two dimensional version.

Relevant Resources

Conley, D. (2008) You may ask yourself: An introduction to thinking like a sociologist New York: W.W. Norton & Company. p. 563.

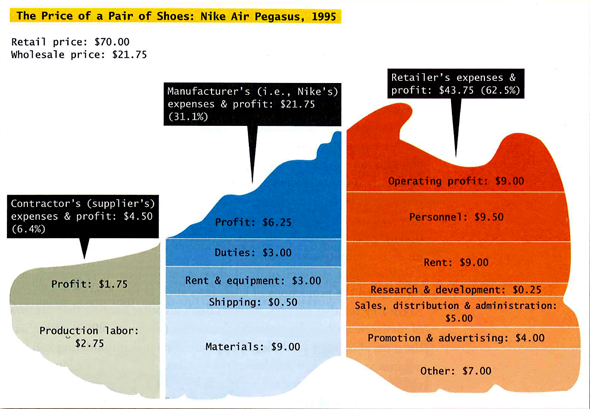
The Price of a Pair of Nike's in 1995 (Conley, 2008)

What Works

The smart thing about this graphic is that it does not oversimplify. The story about Nike that gets told in popular conversation often reduces the profit makers to a monolithic Nike entity. But here we see that profit is extracted at three points in the process – only one of those profit chunks goes to Nike, the other two go to the suppliers and the retailers. It’s also instructive to see just where the rest of the money is allocated – rent, shipping, materials, labor, import duties, marketing, and some rather large “other” catch-all.

What Needs Work

The shape of the shoe just confuses things. It makes it hard to visually compare the relative volumes of the various chunks. It would have been more helpful to skip the gimmicky shoe shape and line up the profit chunks in one row, the labor chunks along a row, and so on for ease of visual comparison. Right now “production labor – $2.75” for the supplier looks to be only a bit smaller than “materials – $9.00” for the manufacturer when in fact, they differ by a factor of three.

Relevant Sources

In case you recognize this citation from yesterday, I should say that I am currently looking at Intro to Sociology text books so I pulled a few things from the same book.

Conley, D. (2008) You may ask yourself: An introduction to thinking like a sociologist New York: W.W. Norton & Company, p. 399.

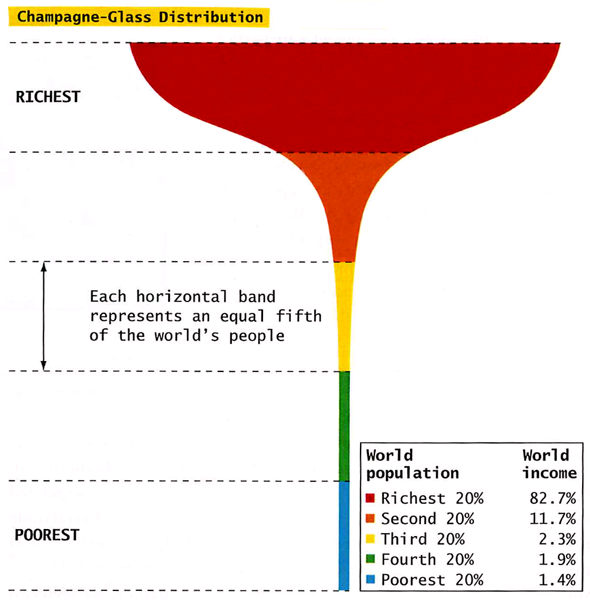
Champagne Glass Distribution from Conley (2008) You May Ask Yourself

What Works

This graphic works as well as it does in part because it evokes the too-delicate feel of a champagne glass in hand. All that wealth resting on so little. The shape does what a data table alone cannot – it subtly suggests that the wealthy are resting on the poor and that the balance is quite precarious.

Relevant Sources

Conley, D. (2008) You may ask yourself: An introduction to thinking like a sociologist. New York: W.W. Norton and Company. p.392.

Chandler, David. L curve [another graphic depicting wealth distribution by a mathematician/educator – it’s interactive.]

Update

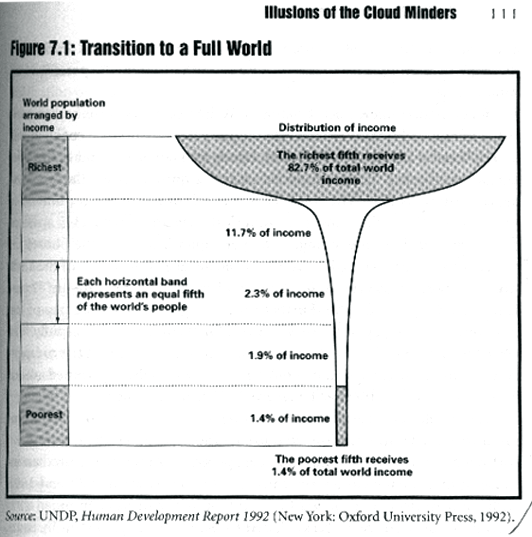
Champagne glass distribution of wealth from UNDP 1992, reprinted in "When Corporations Rule the World"
I found a much earlier 1992 version of the champagne glass distribution of wealth graphic and wanted to give credit where credit is due. It came from the UNDP 1992 “Human Development Report” and was republished in chapter 7 of When Corporations Rule the World by David Korten.

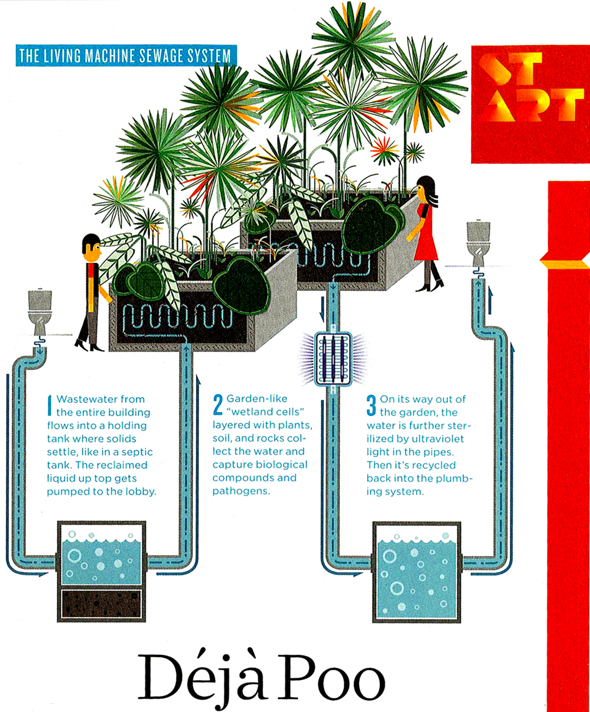
Deja poo - Visualizing wastewater recycling in commercial buildings (Wired, June 2009)

What Works

For some reason, sewage lends itself to visualization quite well. This info-graphic uses less than 100 words to describe the process of wastewater recycling in a commercial building. From toilet bowl back to toilet bowl via a potted garden in the lobby and a UV pipe light.

These kind of cartoon-like diagrams are quite useful as communication tools. The fact that they leave out important details is usually compensated by a verbal presentation or accompanying text.

What Needs Work

In this case, the accompanying text only references a few places where this system will be used in the future. There’s no word on whether it can be installed as a retrofit or any additional technical information about how it works.

Important unanswered questions

Just how many plants per person are needed in the lobby? Do most commercial lobbies have enough space for all that greenery? Could it be installed on a rooftop instead? Would the whole system work better if inhabitants adopted the “if it’s yellow let, it mellow; if its brown, flush it down” toileting strategy? What happens to the sludge at the bottom of the septic tank?

Relevant Sources

Illustration by Leandro Castelao for Deja Poo: The Living Machine Sewage System in Wired Magazine, June 2009: p. 32. Text by Nate Berg.

immigrants_suburbs_sm

What Works

This is beautiful. Just look at it and tell yourself why it works. Think about how crappy it would have been if all the cities had been crammed on to one graph. Stringing them out like this, one city per graph, tells the story of immigrants moving to the suburbs so elegantly. The density increases from left to right with time series adequately represented for each city.

Relevant Resources

DeParle, Jason. (2009 April 28) Struggling to Rise in Suburbs Where Failing Means Fitting In New York Times, part of the Remade in America series.

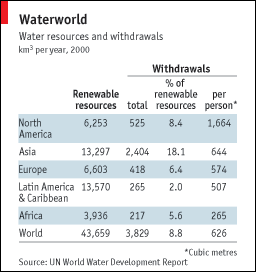
Water Resources and Withdrawals by Continent

These graphics accompanied a great article about water shortages in episode of The Economist which arrived last week. The article was well written and comprehensive, handily summing up the way water resources are related to the growth of urban centers, climate change, the rising affluence of the world’s poorest people (and their conversion from vegetarianism to omnivorousness) and the question of whether or not fresh water is a global or a local problem. I highly recommend reading it. Unfortunately, I think you would do almost as well reading it without the accompanying graphics as with them.

The first one is so confusing I still don’t know what I am seeing here. Table data usually has the attribute that the longer you look at it, the more you get, with an occasionally painfully long initialization period in which you can’t make out any pattern whatsoever. I spent a good bit of time on this one and I still don’t know how to make sense of it. The article rightly points out that fresh water is unevenly distributed across the globe–some places have a lot, some places hardly have any. No big surprise. Also not surprising: some continents use more fresh water than others based on overall population size and agricultural production practices. So when I looked at this graphic, I was kind of hoping to get a sense of both how efficient each continent was with their resources and how dire their straits were. The graphic sort of does that. Sort of. We’ve got a measure of total renewable water resources but it doesn’t take into account total land area. It does take into account population, sort of, and maybe population is more relevant than total land area in this case.

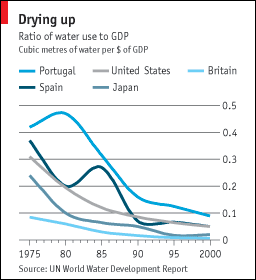
Ratio of Water Use to GDP

The second graphic does not stand well on it’s own. I can see here that it appears that these selected countries seem to have been becoming more efficient with their water use. Since 1995, all of these countries have lowered the number of cubic metres of water used per dollar (or dollar equivalent) of GDP. This graphic does nothing on its own to help me understand why that might be true. Have these countries moved out of water intensive agricultural production? Have they made their agricultural production more efficient? If so, is it technological change leading to increased efficiency or did they just shift to more efficient crops? Or maybe the change is in the GDP variable, not the water variable. The graphic really just doesn’t clear any of these things up.

What Works

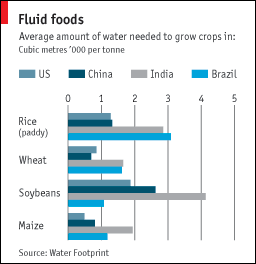
Water Used to Grow the Same Crop in Different Countries

I like the third graphic. It’s clear and adds to the text in the article. This isn’t the first time I have read about water shortages and one of the biggest and possibly easiest changes we could make to prevent the water shortage from becoming any more of a problem than it already is, would be to introduce drip irrigation in places that do not already have it. Yes, it costs some money. But it is far more cost effective than many of the other strategies introduced to combat climate change. Drip irrigation technology is not overly complex nor does it require extensive training or equipment to install. Tubing perforated along its length with small holes, buried under the surface of the earth, delivers water directly to plant roots. Much less water is lost to evaporation or seepage into non-crop areas. Control over water resources is better – during rains cisterns collect and store water for later distribution through the drip tubing during dry periods.

Relevant Resources

The Economist. (2009, 8 April) Water shortages go global: Sin aqua non. Istanbul.

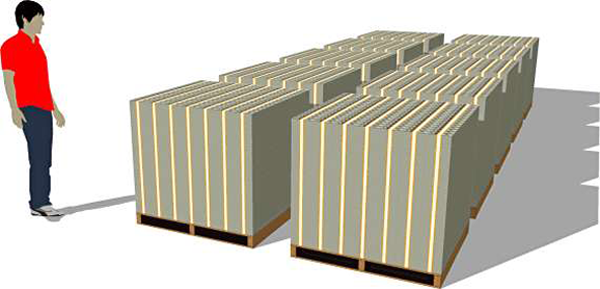
Visualizing a Billion Dollars - Those are pallets
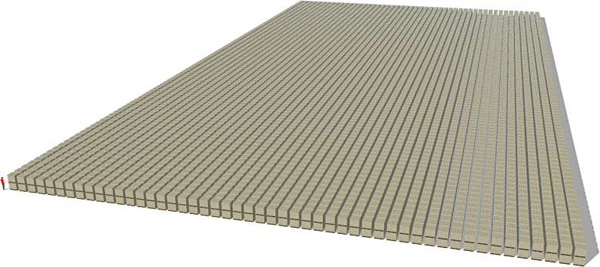
That's a Trillion Dollars - See the guy still in the lower left corner?

What Works

This is a blatant repost of content – all these blogs are – but this one is particularly blatant. [For full effect, click through.] The folks over at pagetour.com went to the trouble to visualize just how much money a billion and a trillion dollars actually is. I have heard on NPR that it’s hard for people to make decisions about monetary volumes once the order of magnitude goes above 7 or 8, that humans unconsciously shift to logarithmic scale thinking which leaves 100 million dollars being only slightly less than 1 billion dollars. That’s like thinking that 100 dollars is only slightly less than 1000 dollars. Have a look. Think about it.

Relevant Resources

pagetour.com A virtual tour of one trillion dollars

Cigarette Tax, Washington State

What Works

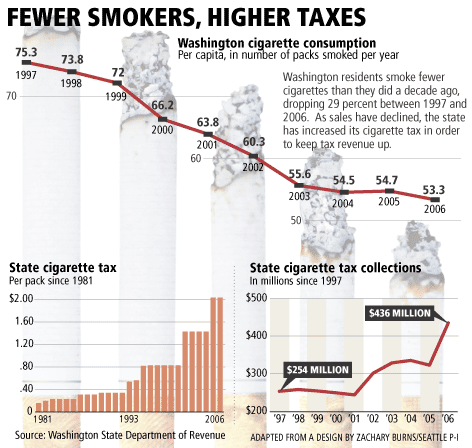
A simple overlay of graphs goes a long way to telling the story that as cigarette taxes increase, rates of smoking decrease. At the deli where I buy snacks, the cost of a pack is $12. Ouch. The reason raising taxes works so well in this situation is that it tends to prevent teens from starting to smoke in the first place because they are relatively poor and cannot afford to support an addiction causing habit. If they don’t start as teens, they are far less likely to start later in life when they might have more disposable income. Increasing tax rates works when it comes to causing a decline in smoking rates, but it might not work in causing other sorts of macro-behavioral changes, at least not over the long run.

Clearly, because we are looking at tax rates and prevalence rates, the two graphs could not share scales. I probably would have gone for either all line graphs or all bar graphs – I don’t like to mix it up for no good reason.

What Needs Work

Not sure I like the use of burning cigarettes as bars, or at least not these ones. Too cartoon-y for a serious subject.

Relevant Resources

Good Magazine (2008) Up in Smoke Interactive Graphic.

Virgin, B. (2007, 6 March) A taxing problem in anti-cigarette age Seattle PI.

Books are still great, no matter what happens on these here internets. They make much better references because the information stays where it is and is accompanied by indices and tables of contents. No link rot, no head scratching while trying to navigate a tag cloud, no wondering if the review was posted by the publisher or an actual reader (ie not the author’s mom, either). They do cost more than free-media (aka e-media?), unless you can find them at your library.

Here’s a start to a list of books you might consider buying if you’re interested in graphic design. Most social scientists might like to be better informed about graphics, but have a bit of trouble getting into it. Below are books that are compelling and beautiful. They won’t tell you how to run the software you might use or write clean html/css or insert hacks for working around the stupidity of IE6. I can post some of those another day, if you like. Our contexts IT guru Jon will be invited to guest blog on the topic of how to do online publishing, as well.

1. Edward Tufte

Tufte is widely regarded as a key figure in graphic design, especially the visual display of quantitative information (which is the title of one of his books). He also has a brilliant essay on powerpoint, of which he is not a fan.

Envisioning Information - Edward Tufte
Visual Explanations - Edward Tufte
The Visual Display of Quantitative Information - Edward Tufte
Beautiful Evidence - Edward Tufte

2. Typography

The Elements of Typographic Style by Robert Bringhurst review by Roy Johnson.

The Elements of Typographic Style by Robert Bringhurst

Typography is a critical component of graphic design. Font size is often the least flexible component and thus serves as a starting point for the rest of the design, assuming the design includes text. With respect to accessibility, small font sizes are terrible since many people have trouble with their eyes. (Even if only a few people had trouble with their eyes, designers should still make inclusive designs.) With respect to design, it is often better to have small fonts so that text blocks read as blocks rather than stripes. Reconciling those two and adhering to branding and identity strategies relies on a firm command of typography. Bringhurst’s book is recommended wide and far so I’m not saying anything new here.

Hoefler and Frere-Jones

Tobias Frere-Jones and his partner Jonathan Hoefler are current giants in the field of typography and have resources on their website – Hoefler & Frere-Jones. They have created typography for the White House, Gucci, the United Nations, Saatchi and Saatchi, Wieden + Kennedy, J. Walter Thompson, all the Martha Stewart magazines, Wired, The New York Times, The Washington Post, Apple, IBM, Sony, and on and on. They represent a sizable portion of the world of font development.

Thinking With Type - Ellen Lupton

Ellen Lupton of Maryland Institute College of Art says/writes much worth hearing/reading, including typography. Her Thinking With Type has it’s own website with additional information. Cheaper than buying the book, but I still recommend owning books if you can afford them.

3. The Grid

Grid Systems in Graphic Design - Josef Muller-Brockmann
Grid Systems in Graphic Design - Josef Muller-Bronfmann

Grid Systems in Graphic Design (Josef Muller-Brockmann)

Muller-Brockmann’s book is a solid introduction to the grid as a design framework. It’s good to read if you know nothing about design and good to read if you need a refresher in the basics, before you slide down what can be a slippery Flash-driven rabbit hole into a world where nothing makes sense.

See also tutorialblog on the use of grid systems in web design.

4. Universal Principles of Design by William Lidwell, Kritina Holden and Jill Butler

Universal Principles of Design - Lidwell, Holden and Butler

This book is not just about graphic design, but is more, well, universal, as the title suggests. It’s organized alphabetically, with one page of explanation and one page of examples for each of the 100 principles they’ve chosen. They admit that there are more than 100 principles, but they had to cut it off somewhere. Included are the 80/20 rule (or pareto’s principle), the Fibonacci sequence, the golden ratio, the baby face principle, and so on. I was so fascinated by it that I couldn’t put it down.

5. 79 Short Essays on Design by Michael Beirut of Pentagram

79 Short Essays on Design by Michael Beirut

Michael Beirut is a towering figure in design, as is the company he works for, Pentagram. His little collection of essays includes some gems, though not all are equally worthy of recommendation. The book has been widely recommended by others; maybe they were more evenly impressed by the collection than I was. Good one for checking out of the library because all the essays go pretty quickly so it would be nice to read on the train.

6. Design Blog Recommendation #1

Design Observer - Helfland and Drenttel

Design Observer and the related Winterhouse Institute (Jessica Helfand and Bill Drenttel)

This last one is a blog you might want to follow that features design related books, articles, entries, videos and so on. I am new to following it, but I like it so far.