What Works
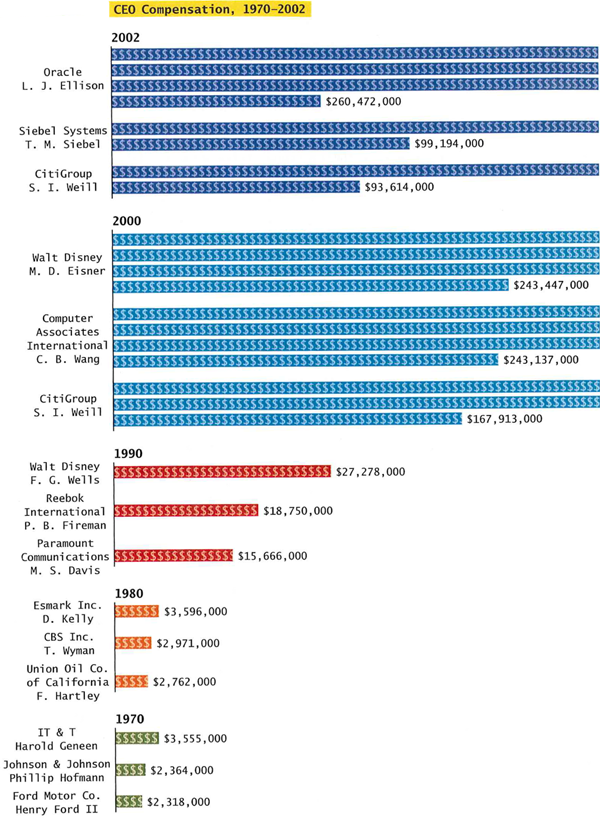
This is a great concept because CEO compensation has ballooned relative to compensation for the rest of us.
What Needs Work
I would like to see some of the comparative data on compensation for the rest of the work force somehow, not just CEOs.
It would be nice for the graphic to say that the figures are all in year 2000 dollars.
Collapsing the bars instead of stringing them out diminishes the visual impact dramatically. If the highest compensation was displayed end-to-end instead of broken up and stacked it would look far more disparate compared to the 1970 compensation data. Now, realizing that this would skew the page layout, the graphic designer could have pursued a volumetric portrayal instead of just a two dimensional version.
Relevant Resources
Conley, D. (2008) You may ask yourself: An introduction to thinking like a sociologist New York: W.W. Norton & Company. p. 563.
