What works
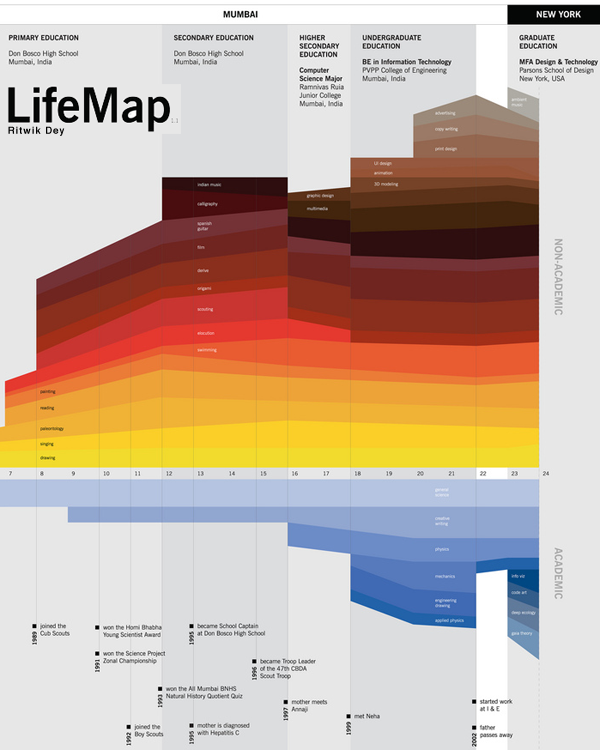
This is a great timeline. If all CVs were displayed like this I think employers would have a much better idea who they’re hiring.
Here’s why I like it:
- LifeMap
- shows simultaneity – layering colored strips
- shows relative weights – some stripes are fatter than others
- shows the split between two classes of life – academic and personal by simply sticking the axis between them and then emphasizing this split with a different color scheme for each class
- mixes words seamlessly with the graphic elements – each of the activities on the map is listed only once, even if the band it occupies shifts noticeably. Re-listing each element would add clutter and the colors are easy for the eye to follow across the graph even where there are discontinuities.
- displays location at the top without making location seem like the primary element. It’s hard to get the thing that appears at the top NOT to seem like the most important. Clearly, in the course of a life, moving from Mumbai to New York is a big deal, so this is a critical component, but it doesn’t dominate the graphic. We are able to see the elements that make the leap from one place to the next but we aren’t quite sure if it was the shift from one place to the next or from one level of schooling to the next…and maybe even Mr. Dey doesn’t know. How can anyone untangle the causality of an individual trajectory?
It’s clear to me that many of the design elements here will be useful for future portrayals of social science data. In this case, I’d say we are looking at an enhanced CV, brave enough to indicate the passing of a parent and even a mother’s new relationship (which preceded the passing of the father). Spare visual narrative, intriguing in what is left out, remarkably rich nevertheless.
What needs work
The font relative to the graphic is too small. I know that this was probably intended as a poster and displayed at such a scale that the font wasn’t a problem. I apologize that you have to click through to see all of the categories.
Another comment while we’re on the topic of fonts and words relative to graphics: Mr. Dey was able to describe all of his interests with one or two words. It looks great. He expanded his accomplishments a bit beyond the two word limit, but they are still quite brief. I like the idea of choosing the one, two or three most precise words and making sure the graphic itself can carry the rest of the message. It’s a good test to see if your design is helping – when it can speak almost on its own things are looking good.
The limited number of words makes the whole thing not only visually and verbally poetic but also increases its functional value. One of my functionality measuring sticks is the number of words a person would have to translate if they were trying to read this graphic in a foreign language. The fewer words, the easier it is for non-English speakers. The more specific the words are, the more likely they are to translate appropriately. Therefore, ‘swimming’ and ‘3D modeling’ probably translate without difficulty. I have no idea if there is any kind of meaningful translation of “scouts” or “scouting” in any language other than English, but that is not a problem any graphic designer is going to be able to solve.
I wonder, though, if no-more-than-two-words rule led to the choice of the word “derive”. I know what that means in the context of calculus. I have no idea what that means in the context of a LifeMap, but it remains salient for years so I wish I did know what it meant. Sometimes the word restriction rule leaves out the phrase that would best describe whatever it is you might be trying to describe. Or maybe Mr. Dey does a lot of theoretical derivations.
References
Dey, Ritwik. (2005) LifeMap Project for Information Design course with Dmitry Krasny at Parsons School of Design in New York City.

Comments 4
Philip Cohen — November 23, 2010
I love it, but am confused. What is the y-axis? Amount of time spent in a given year? Or (on the bottom half) amount of professional time? Then it should sum to 100%. I'd love to try to use this, but am stumped by that.
Raluca — December 10, 2010
can this life map be used somehow? is there any life map model that can be downloaded and used for personal use?
Steven White — January 4, 2011
The y-axis seems to be a rough approximation of how much time/effort was place on each subject or area of study. The most important aspect of this to me is that it shows the humanity of a CV/resume. He still spent time with certain types of work & study even though he had aged a bit or moved to a different portion of is life. Also, having he x-axis show age instead of what year these things happened is places emphasis on the what instead of the when.
But I've also not found any ref. to how this map was created. I'm guessing it was done by hand with graphic design tools, as opposed to using a piece of software to input data and create a living document.