Search results for day care

Cross-posted at Montclair SocioBlog.

If your survey doesn’t find what you want it to find . . .

. . . say that it did.

Doug Schoen is a pollster who wants the Democrats to distance themselves from the Occupy Wall Street protesters.   (Schoen is Mayor Bloomberg’s pollster.  He has also worked for Bill Clinton.)  In the Wall Street Journal,  he reported on a survey done by a researcher at his firm.  She interviewed 200 of the protesters in Zucotti Park.

Here is Schoen’s overall take:

What binds a large majority of the protesters together—regardless of age, socioeconomic status or education—is a deep commitment to left-wing policies: opposition to free-market capitalism and support for radical redistribution of wealth, intense regulation of the private sector, and protectionist policies to keep American jobs from going overseas.

I suppose it’s nitpicking to point out that the survey did not ask about SES or education.  Even if it had, breaking the 200 respondents down into these categories would give numbers too small for comparison.

More to the point, that “large majority” opposed to free-market capitalism is 4% — eight of the people interviewed.  Another eight said they wanted “radical redistribution of wealth.”  So at most, 16 people, 8%, mentioned these goals.  (The full results of the survey are available here.)

What would you like to see the Occupy Wall Street movement achieve? {Open Ended}

35% Influence the Democratic Party the way the Tea Party has influenced the GOP
4% Radical redistribution of wealth
5% Overhaul of tax system: replace income tax with flat tax
7% Direct Democracy
9% Engage & mobilize Progressives
9% Promote a national conversation
11% Break the two-party duopoly
4% Dissolution of our representative democracy/capitalist system
4% Single payer health care
4% Pull out of Afghanistan immediately
8% Not sure

Schoen’s distortion reminded me of this photo that I took on Saturday (it was our semi-annual Sociology New York Walk, and Zucotti Park was our first stop).

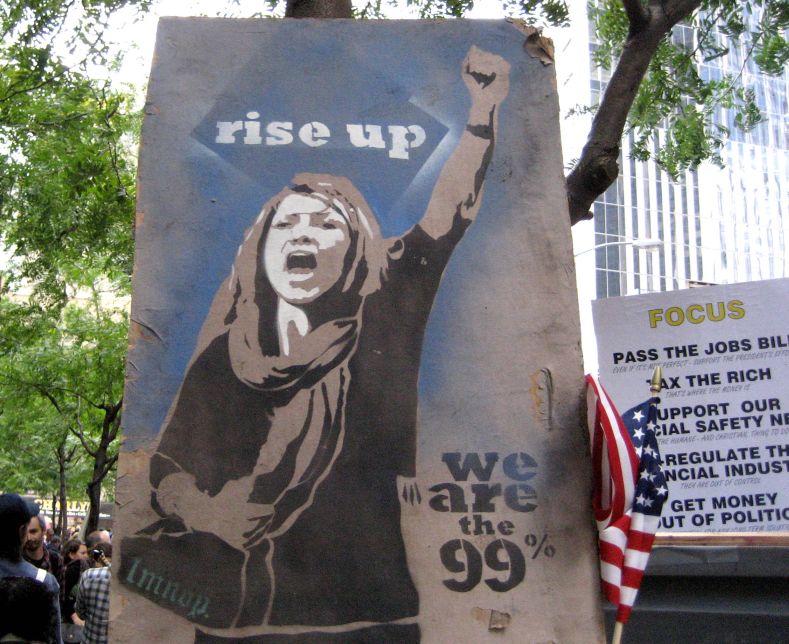
The big poster in the foreground, the one that captures your attention, is radical militance — the waif from the “Les Mis” poster turned revolutionary.  But the specific points on the sign at the right are conventional liberal policies — the policies of the current Administration.

There are other ways to misinterpret survey results.  Here is Schoen in the WSJ:

Sixty-five percent say that government has a moral responsibility to guarantee all citizens access to affordable health care, a college education, and a secure retirement—no matter the cost.

Here is the actual question:

Do you agree or disagree with the following statement: Government has a moral responsibility to guarantee healthcare, college education, and a secure retirement for all.

“No matter the cost” is not in the question.  As careful survey researchers know, even slight changes in wording can affect responses.  And including or omitting “no matter the cost” is hardly a slight change.

As evidence for the extreme radicalism of the protestors, Schoen says,

By a large margin (77%-22%), they support raising taxes on the wealthiest Americans,

Schoen doesn’t bother to mention that this isn’t much different from what you’d find outside Zucotti Park.  Recent polls by Pew and Gallup find support for increased taxes on the wealthy ($250,000 or more) at 67%.  (Given the small sample size of the Zucotti poll, 67% may be within the margin of error.)  Gallup also finds the majorities of two-thirds or more think that banks, large corporations, and lobbyists have too much power.

Thus Occupy Wall Street is a group of engaged progressives who are disillusioned with the capitalist system and have a distinct activist orientation. . . . .Half (52%) have participated in a political movement before.

That means that half the protesters were never politically active until Occupy Wall Street inspired them.

Reading Schoen, you get the impression that these are hard-core activists, old hands at political demonstrations, with Phil Ochs on their iPods and a well-thumbed copy of “The Manifesto” in their pockets.  In fact, the protesters were mostly young people with not much political experience who wanted to work within the system (i.e., with the Democratic party) to achieve fairly conventional goals, like keeping the financial industry from driving the economy into a ditch again.

And according to a recent Time survey, more than half of America views them favorably.

Children are our most important resource.  Everyone says it, but we don’t really mean it.

Exhibit one: the percentage of children under the age of 18 that live in poverty. In 2007, at the peak of our previous economic expansion, the child poverty rate was 18%.  In 2009, it hit 20%.  The figure below provides a look at child poverty rates in each state.  New Hampshire had the lowest rate: 11%.  Mississippi the highest rate: 31%. According to a recently released Census Bureau study, the 2010 national child poverty rate was 22%.


poverty.jpg


How Do We Measure Poverty?

Children under the age of 18 are counted as poor if they live in families with income below U.S. poverty thresholds.  There are a range of poverty thresholds which are based on family size and number of children.  These poverty thresholds are far from generous.  The 2009 poverty threshold for a family of two adults and two children was$21,756.

Sadly our poverty rates understate the seriousness of our poverty problem, for children and adults.  The history of how we developed and calculate our official poverty thresholds provides perhaps the clearest proof of the inadequacy of current statistics.  First introduced in 1965, the thresholds were based on previous work by the Department of Agriculture (DOA).  The DOA created an “economy” food plan in the 1950s that was designed for “temporary or emergency use when funds are low.”  DOA surveys had also established that families of three or more persons spent approximately one-third of their after tax income on food.  Our initial thresholds were set by multiplying the cost of the economy food plan (adjusted for family size) by three.

From 1966 to 1969, these poverty thresholds were revised annually by the yearly change in the cost of the items contained in the economy food plan.  After 1969, and still today, the poverty thresholds were adjusted by the rise in the consumer price index.

Our poverty rates are calculated by comparing pre-tax family incomes to these thresholds.

Why the Poverty Threshold is Deficient

This methodology has produced a poverty standard and estimates of poverty that are deficient for several important reasons:

First, our knowledge of nutrition has significantly changed since the 1950s.

Second, families now spend approximately one-fifth of their after-tax income on food, not one-third.  That correction alone would mean that the food budget should be multiplied by 5 rather than 3, thereby producing higher thresholds and poverty rates.

Third, poverty is best thought of as a relative condition, which means that it should not be measured by comparing incomes to an unchanging standard based on the cost of a 1950’s economy food plan.

Fourth, poverty rates should be calculated using after-tax family income adjusted to include the value of government support programs like food stamps (which are also fluctuating and often cut in hard times), not unadjusted pre-tax family income.

A Better Measure

Researchers, drawing on the work of the National Academy of Sciences Panel on Poverty and Family Assistance Economists, have developed an alternative experimental approach to measuring poverty.  They start with a reference family, two adults and two children.  Then, using Consumer Expenditure Surveys, they calculate the dollar amount of spending on food, clothing, shelter, utilities and medical care by all reference families in a given year.

The poverty threshold for the reference family is set at the midpoint between the 30th and 35th percentile of the spending distribution for all families with two adults and two children.  Small multipliers are then used to add spending estimates for other needs, such as transportation and personal care, slightly raising the poverty threshold.   This threshold is adjusted for families of other compositions.

The chart below shows national poverty rates for the years 1996 to 2005.  We see that the rates produced by this experimental methodology are significantly higher than the official rates.

comparison.jpg

Strikingly, while the official poverty rate is lower in 2005 than in 1996, the 2005 experimental poverty rate is the highest in the period.  The difference is largely explained by the fact that the experimental measure incorporates changes in the availability of social programs and the relative importance of non-food goods and services in family spending.

Returning to the issue of child poverty, the table below highlights the difference between the two measures for specific demographic groups.  Notice that the child poverty rate calculated using the experimental measure is always higher than the official rate.  As previously stated, the official 2010 child poverty rate is 22 percent.  The experimental rate would no doubt be several percentage points higher, closing in on 25 percent.

poverty-table.jpg

What can one say about a situation where between one-fifth and one-fourth of all children in the United States live in poverty?  Language like “outrageous,” “unacceptable,” and “indicator of a flawed economic system” comes to mind.  What also comes to mind is the fact that these poverty statistics rarely get the attention they deserve, as does the question of why that is so.

In this ten-minute video, Feminist Frequency‘s Anita Sarkeesian does a great job of discussing the problem with “straw feminists,” overtly feminist characters who are made to look bitchy, ridiculous, or just plain wrong… even when they’re describing forms of gender inequality that really exist.  More, they’re used to suggest that feminism places men and women in opposition when, in fact, gendered expectations and institutions are oppressive to men as well.

By demonizing these characters, Sarkeesian concludes, the straw feminist leads real women to disassociate from feminism, even when they believe in the equal rights of men and women.

Transcript after the jump:

more...

Cross-posted at The Oreo Experience.

With the summer over, it’s time for Hollywood to pull out a new season of films. Here’s some of what’s coming up this fall and winter. For each trailer, I note what white people get to do and what non-white people get to do.

Let us begin:

Bucky Larson: Born to Be a Star

Things White People Get to Do: Be part of a loving family, be content with simple things, be blissfully unaware, be sweet, be naive, be oddly cool, progressive parents, live in a small town, live in a big city, parody Almost Famous, be hot, be regular looking, be super hot with a regular looking boyfriend, be the hero.

Things Not-White People Get to Do: be threatening, drive a car.

Contagion

Things White People Get to Do in This Movie: Play craps, have a family, be an expert, cry convincingly, deliver bad news, be unable to accept bad news, probably be the focal point of a conspiracy, populate towns.

Things Not-White People Get to Do in This Movie: Play craps, provide and clarify exposition.

Main Street

Things White People Get to Do: Fake an American accent, come up with a plan, be taken advantage of by the boss, be savvy about the boss, believe a stranger, be troubled, look out for the troubled, work in an office.

Things Not-White People Get to Do: Believe a stranger.

Warrior

Things White People Get to Do: have tattoos, cage fight, announce fights, reconnect with parents, gamble, join the military, lose a home, offer help, make up for lost time, walk around the house in matched undies and undershirt, throw tires around, be an adorable father, kiss the girl, be a war hero, cheer supportability, go head to head.

Things Not-White People Get to Do: walk through frame, lose a fight

I Don’t Know How She Does It

Things White People Get to Do: Have a career AND a family and be totes supes adorbs about it.

Things Not-White People Get to Do: n/a

Straw Dogs

Things White People Get to Do: Watch old movies, be in old movies, be way too aggressive, terrorize innocents, be a cheerleader, have sex, have a nice date, disrespect their partners, sexually harass women, fight back against bullies, go to church, rise to the challenge, wield a tire iron, use boiling water effectively.

Things Not-White People Get to Do: n/a

Drive

Things White People Get to Do: be really good at driving, set up dirty deals, be mobsters, live in a big city, meet guys in elevators, be a stunt person, be a loving single mom, get their hands on more money than they were expecting, kiss the girl, bash someone’s head in, wear freaky masks, slit some throats, be the dad the dad couldn’t be.

Things Not-White People Get to Do: be a felon.


30 more movie trailers after the jump:

more...

Yesterday NPR reported that Wisconsin is considering repealing its ban on margarine in private businesses and public buildings. What is that all about!? This old post offers some great historical context.

—————————

Grass fed cows tend to produce milk that, when made into butter, has a slightly yellow color.  When margarine was invented as a butter substitute and they began producing it for U.S. consumption in the late 1880s, one marketing problem was its color.  The vegetable-based product has a clear, white-ish color and looks something like lard; many people found it unappetizing.  So the margarine people wanted to dye margarine yellow.

The dairy industry rightly saw margarine as a threat and they lobbied politicians both to outright ban margarine or to ban dying it to look like butter.  The federal government imposed a two cent per pound tax on the product in The Margarine Act of 1886 (the tax was quintupled in 1902).  Many states, especially dairy states, made dying margarine illegal (e.g., New York, New Jersey, and Maryland).  By 1902, “32 states and 80% of the U.S. population lived under margarine color bans.”

The ad below is for “Golden Yellow” margarine and specifies that it is “ready to spread” in 26 states (more text transcribed below):

In some states, margarine manufacturers would sell margarine in plastic bags with a small bead of dye that the buyer had to knead into the spread (“Color-Kwik bags”).  This practice continued through World War II. If you judge by this ad, it was quite a good time:

Picture1

Over time, as supply and demand for butter and margarine ebbed and flowed alongside federal rules and penalizing taxes on margarine, the popularity of each ebbed and flowed too.  Then, in 1950, margarine was apparently the “the talk of the country” and President Truman put an end to the oppression of margarine, in part because the National Association of Margarine Manufacturers had begun to build enough power to compete with dairy associations.  Wisconsin, the cheese state, was the last anti-margarine state hold out (till 1967), but it continued to forbid margarine in public places (unless requested; as of Sept. 2011).

By 1957, sales of margarine exceeded those of butter. Margarine still outsells butter today. And, in a bizarre reversal, butter manufacturers now regularly dye butter yellow.

—————————

All that said, here is an excerpt from Audre Lorde’s The Uses of the Erotic in which she uses the bead of dye in the bag of margarine as a metaphor for sexuality:

During World War II, we bought sealed plastic packets of white, uncolored margarine, with a tiny, intense pellet of yellow colloring perched like a topaz just inside the clear skin of the bag.  We would leave the margarine out for a while to soften, and then we would pinch the little pellet to break it inside the bag, releasing the rich yellowness into the soft pale mass of margarine.  Then taking it carefully between our fingers, we would knead it gently back and forth, over and over, until the color had spread throughout the whole pound bag of margarine, thoroughly coloring it.

I find the erotic such a kernel within myself.  When released from its intense and constrained pellet, it flows through and colors my life with a kind of energy that heightens and sensitizes and strengthens all my experience.

Sources: Vintage Ads, Found in Mom’s Basement, Britannica, Margarine.org, and FoodReference.

Lisa Wade, PhD is an Associate Professor at Tulane University. She is the author of American Hookup, a book about college sexual culture; a textbook about gender; and a forthcoming introductory text: Terrible Magnificent Sociology. You can follow her on Twitter and Instagram.

Course Guide for
SOCIOLOGY OF GENDER
(last updated 09/2011)


Developed by Mary Nell Trautner, PhD
University at Buffalo, SUNY


Social Construction of Sex & Gender

Intersexuality


Patriarchy / Oppression

Patriarchy as Male Dominated

Patriarchy as Male Identified

Patriarchy as Male Centered


“Doing Gender,” Gender as Performance


Intersectionality

White privilege


Childhood Gender Socialization


Gender & Language


Gender & Mass Media


Gender & Work

The Wage Gap


Gender & Sports


Sexuality: Homophobia


Sexuality: Sexual Behavior


Gender & the Body

Physical appearance and beauty work

Obesity and overweight


Gender and Family


Hegemonic Masculinity


Intimate Partner Violence


Sexual Harassment


Forced Sex & Sexual Assault

Anti-Rape Campaigns


Visions for the Future

If you would like to write a Course Guide for Sociological Images, please email us at socimages@thesocietypages.org.

A longer version is cross-posted at Montclair SocioBlog.

Long before the Freakonomics guys hit the best seller list by casting their economic net in sociological waters, there was Gary Becker.  If you want to explain why people (some people) commit crimes or get married and have babies, Becker argued, just assume that people are economically rational.  Follow the money and look at the bottom line.  You don’t need concepts like culture or socialization, which in any case are vague and hard to measure.*

Becker wrote no best-sellers, but he did win a Nobel.  His acceptance speech: “The Economic Way of Looking at Behavior.”

In a Wall Street Journal op-ed Friday about the recession, Becker started off Labor Day weekend weighing in on unemployment and the stalled recovery.  His explanation: in a word, uncertainty.

These laws [financial regulation, consumer protection] and the continuing calls for additional regulations and taxes have broadened the uncertainty about the economic environment facing businesses and consumers. This uncertainty decreased the incentives to invest in long-lived producer and consumer goods. Particularly discouraged was the creation of small businesses, which are a major source of new hires.

There’s something curious about this.  Becker pushes uncertainty to the front of the line-up and says not a word about the usual economic suspects – sales, costs, customers, demand.  It’s all about the psychology of those in small business, their perceptions and feelings of uncertainty.  Not only are these vague and hard to measure, but as far as I know, we do not have any real data about them.  Becker provides no references.  The closest thing I could find was a small business survey from last year, and it showed that people in small business were far more worried about too little demand than about too much regulation.

Compared with Regulation, twice as many cited Sales as the number one problem.  (My posts on uncertainty from earlier this summer are here and here.)

In addition, the sectors of the economy that should be most uncertain about regulation – finance, mining and fuel extraction, and medical care – are those where unemployment is lowest.

More, as David Weidner writes in the Wall Street Journal, taxes, interest rates, and regulation at an all-time low.

[The uncertainty-about-taxes-and-regulation argument] would make more sense if, say, taxes were already high and might be going higher or regulatory burdens were heavy and might be getting heavier. But when taxes are at a 60-year low and the regulations are pretty much the same as they were in the 1990s boom, the argument makes no sense at all (Mark Thoma quoting an e-mail from Gary Burtless).

If it’s really uncertainty caused by these things that causes a reluctance to hire, the time to invest and hire should be now.

—————————

* This is an oversimplified version, but it will do for present purposes.

This Course Guide is in progress and will be updated as I have time.

Disclaimer: If you’re thinking about writing a course guide.  I totally overdid it on this one!  It doesn’t have to be nearly this extensive.


Course Guide for
INTRODUCTION TO SOCIOLOGY

(last updated 5/2012)

Developed by Gwen Sharp
Nevada State College


C. Wright Mills and the Sociological Imagination

Intersection of biography and history as illustrated by:

“the capacity for astonishment is made lively again”

Karl Marx/Marxist analysis

Emile Durkheim

[Because the course guide has gotten to be so long, I’m putting the rest of it after the jump.]

more...