Europe

Living Alone by Gender, Age Cohort in the US
Living Alone by Gender, Age Cohort in the US since 1850

What works

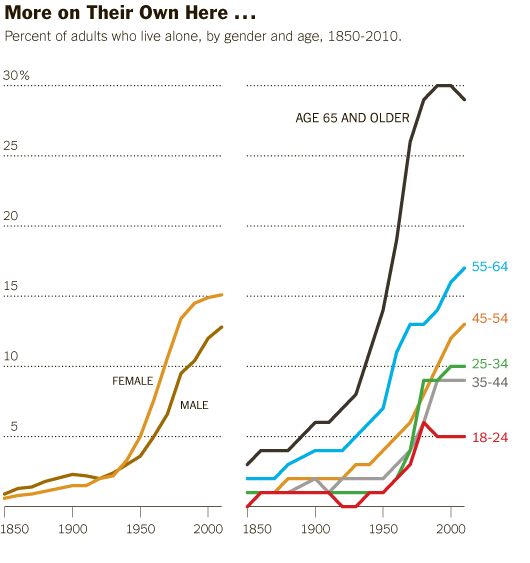
This post is an update to an earlier post about the increasing rate of Americans living alone. The first graph does an excellent job of visualizing the change in Americans’ tendencies to live alone, by age and gender. It’s clear that living alone is on the rise, especially for Americans over 45. It’s interesting that there seems to be a collective slow down in this trend in the decade between 35 and 45 when I suppose some of the late-to-marry people finally settle down and before the marital dissolution rate starts to fire up.

The graphics in this post accompanied an article by Eric Klinenberg in the New York Times Sunday Review that laid out the basic findings in his latest book, “Going Solo” that was based on 300 interviews with people living alone. He finds that while for some, living alone is an unwanted, unpleasant experience, most people who live alone are satisfied with their personal lives more often than not. In fact, they are more social, at least in some ways, than are their counter-parts who live with others. Singletons (his word, not mine. I prefer ‘solos’ in part because it’s an anagram), go to restaurants and other social spaces more often than do those who live with others.
Living alone in Minneapolis

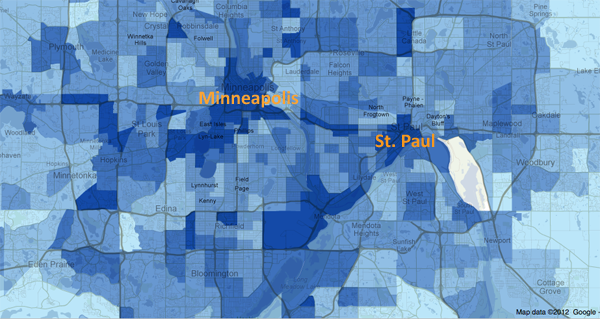
In a number of cities, including Minneapolis, more than 40% of households are single-people households. The article included an interactive map down to the census tract level that shows what percentage of households in that tract were single-person households in 2010. I took a look at Minneapolis and St. Paul and found that the map supported Klinenberg’s qualitative findings. The highest concentration of solos is in the center city areas where opportunities to get out and be social in the community are the highest. The suburbs and rural areas have fewer solos.

I encourage others to use the map and see if their local cities replicate this pattern, that more solos live in ‘happening’ areas than in quieter areas. Of course, this could be caused by a third variable, the presence of households that are affordable for single-earner households…but there isn’t enough analytical power in the map tool to be able to sort out the dependencies.

What needs work

The information about who lives alone by age, marital status, and race that is displayed in the following long skinny stack of datapoints is the right kind of detailed information to use as an entrance into a deeper discussion about living alone, now that we’ve gotten a sense of the view from 30.000 feet. The problem is that this graphic is hard to read, too long for a single computer screen (but in order to make sense of it, one needs to see the whole thing at once), and too optimistic about what color differences are able to do than is reasonable.

The article does a better job of subtly navigating the movement from historical and international context into a detailed, robust analysis. By awkwardly pinning all the data points onto the stalk at once, viewers lose the ability to see patterns within data subsets. Here’s a test. Look at the following data and try to explain to yourself how race and living alone go together. Or how age and living alone go together. The graphic designer was hoping color would be able to do more than it has been able to accomplish here. The color is supposed to tunnel your vision down to a particular color-coded subset so that you can start to understand well just what it is about race or age or marital status that produces particular patterns in living alone. But I had a lot of trouble with the color frame because, quite literally, I had to keep shifting the frame around this graphic – it didn’t fit on my laptop screen. [Graphic designers often work on nice, roomy screens where they end up seeing more at once than their eventual audience who is probably peering at this thing from a web browser on a laptop or occupying half of a monitor somewhere.]

All the clustering around the mean is another problem that could have been avoided had the graphic been organized differently. As it is, all sorts of groups lump on top of one another down around 14%.

I also kind of hate that I can’t add categories together in any meaningful way here. I can tell that being a widow would put someone at high risk for living alone, but that’s kind of a no-brainer, isn’t it? I would have gotten more mileage out of visualizing the absolute numbers of people living alone by marital status, age, and race. Maybe over half of all widows live alone, but I haven’t the faintest idea how many widows there are in America so I don’t know if half of all widows is half a million people? Or 3 million people? Or whether it’s more or less than the 38% of separated people who are living alone. 19% of never married’s live alone, but because these people are likely to be young, maybe that is actually a larger absolute group than the 58% of widows living alone.

Final verdict: There was both a data fail and a graphic design fail.

Who lives alone?
Who lives alone? A demographic breakdown

References

Going Solo Cover
Going Solo Cover

Klinenberg, Eric. (2012) Going Solo: The Extraordinary Rise and Surprising Appeal of Living Alone. The Penguin Press HC.

Klinenberg, Eric. (2012) One’s a Crowd. New York Times Sunday Review.

Weber, Susan and Beveridge, Andrew. (2012) [infographics]
Solo in America graphic Line graph looking of the changing percentage of singleton households in America, 1850-2000
More on their own here…and even more abroad American and International singleton households.
Mapping the US Census: Percentage of Households with only one occupant Interactive graphic of US singleton households by census tract.

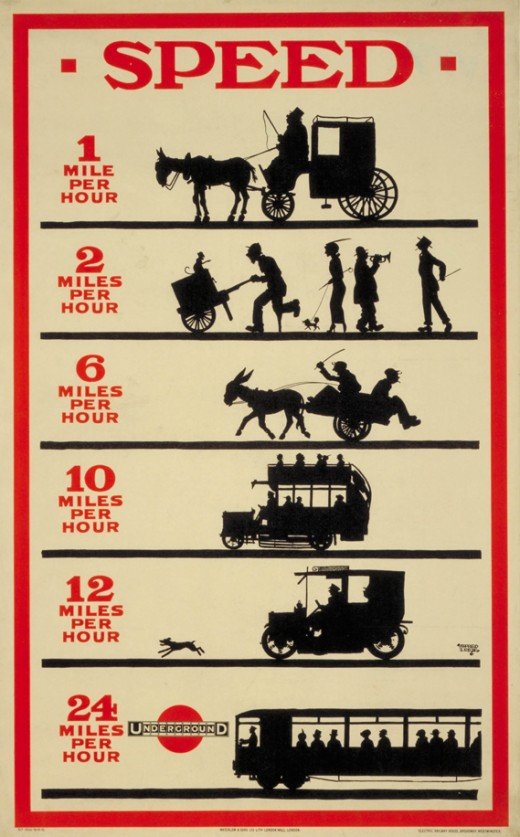
London Underground Ad 1915

What works

The London Underground has a lengthy history of using infographic thinking in their advertisements (see these ads and more on retronaut.co). What works here is that some of these ads, especially the first one, could still be used with positive impact today if the silhouettes were updated to include the transit types actually on the street out there. If I saw an infographic that compared the speed of walking (with and without a stroller), taking the subway, taking a cab, and biking to incite me to take the subway or bike, I would find that compelling. I’d imagine many New Yorkers would agree with me. Probably so would Londoners. It is remarkable how long lasting this ad is.

What needs work

The ad needs to have a better implementation of the scale associations in the miles per hour that would help communicate the idea that the underground is faster than all the other modes of mobility. If someone were to make this infographic today, they would probably make the slower forms of mobility look shorter (almost like applying a bar graph where the slower mobility forms haven’t made it as far across the page). They probably would also scale the size of the number representing kilometers per hour. Maybe they would become more and more italicized, leaning farther and farther to the right to indicate speed. Maybe they just would have gotten bigger as they approached the fastest speed.

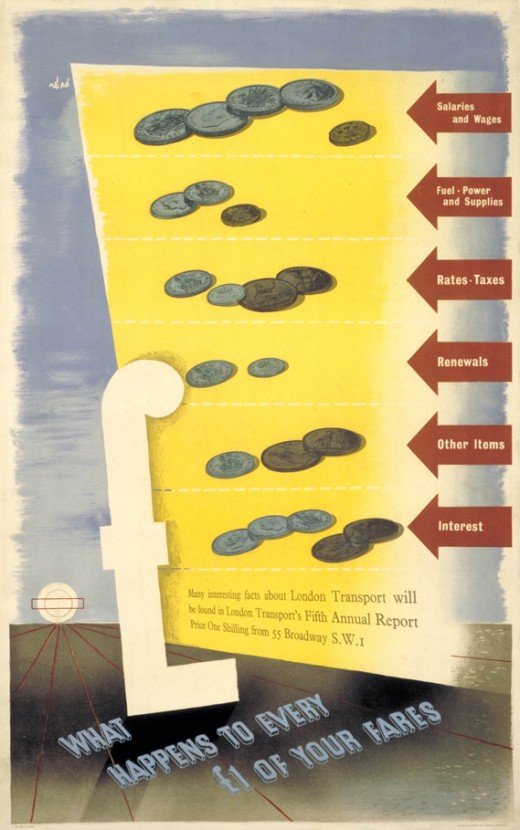
Moving on in time, I think the next ads for the London Underground are actually not as strong as this first one, at least until we get to 1969. We see below a graphic that is supposed to help Londoners understand what their Underground fares are actually funding, but there is no scale comparison available from one ‘bar’ in the bar graph to the next. What’s more, the numbers associated with the bars are represented by the coinage. The viewer has to do the math by himself or herself. Personally, I find that to be a kind of naive approach to representing the fare distribution, one that has the viewer doing mental work to add up coinage, which is kind of incidental to the question, rather than comparing one category of expenditures to the others, which is the heart of the question that was posed.

London Underground Ad 1938

The Individual Group, Pop Art, and London Underground ad improvements

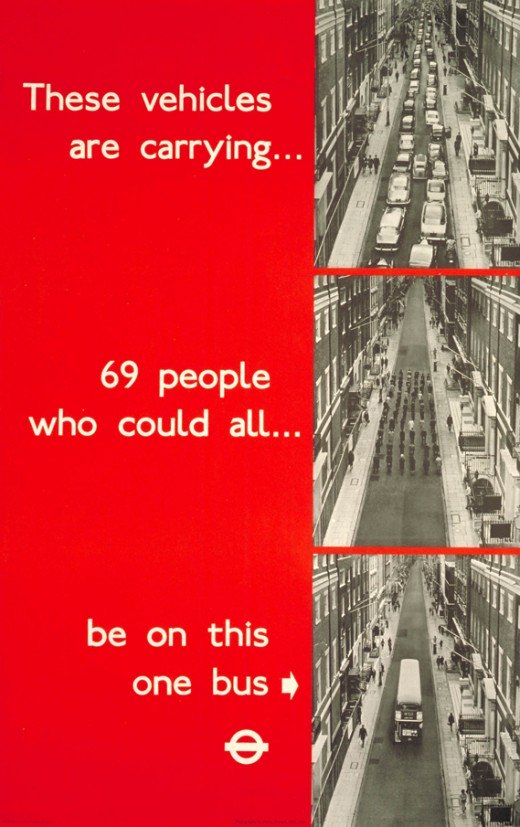
This ad is much better, more compelling, it still carries the idea of infographic representation from the fare split into coinage by representing people not as dots but by keeping them as actual people (or passenger cars). The photo of a street full of cars that stretch so far we can’t see the end of it steps to a photo of just the human bodies carried by those cars and finally all those humans on a single bus. This particular instantiation of that idea is much stronger. In my opinion, I imagine the advertisers here having been influenced by the artistic work of the UK’s Individual Group who were the British version of American Pop Artists.

London Underground Ad 1969

Artistic comparison

Just for fun, compare the ad above with some work by American Feminist Artist Barbara Kruger (for you non-art history people, feminist art followed pop art and used a lot of performance work but also maintained some of the pop art movement’s interest in the tropes of advertising, collage techniques, and the use of text in art. See also later conceptual artist Jenny Holzer.)

Barbara Kruger "Your gaze hits the side of my face" 1982
Barbara Kruger "Your Manias Become Science" 1981
Barbara Kruger "Untitled" 1981

References

Retronaut.co (4 January 2012) London Transport Infographics, 1912-1969 [blog post].

Kruger, Barbara. (1981) Untitled. [collage] Accessed online at http://www.eng.fju.edu.tw/Literary_Criticism/feminism/kruger/kruger.htm

Kruger, Barbara. (1981) Untitled. [collage] Accessed online at http://www.eng.fju.edu.tw/Literary_Criticism/feminism/kruger/kruger.htm

Kruger, Barbara. (1982) “Your gaze hits the side of my face” [collage] Accessed online at New York University’s Fales Collection at Bobst Library http://www.nyu.edu/library/bobst/research/fales/exhibits/downtown/soho/sohoart/documents/kruger.html.

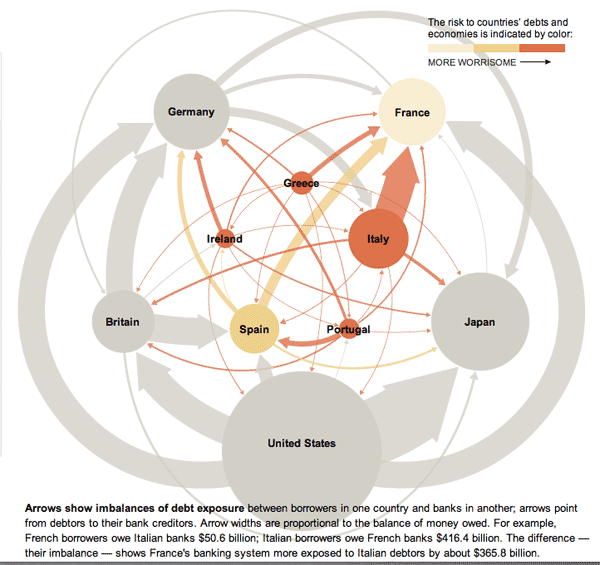
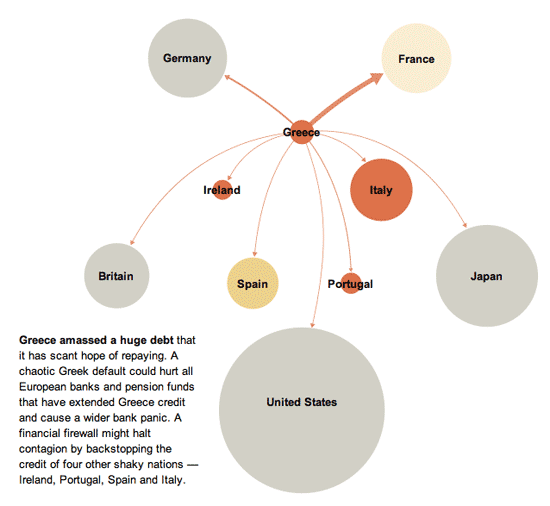
Euro Zone Debt Crisis Visualized | Overview: It's all connected
Euro Zone Debt Crisis Visualized | The Immediate Trouble
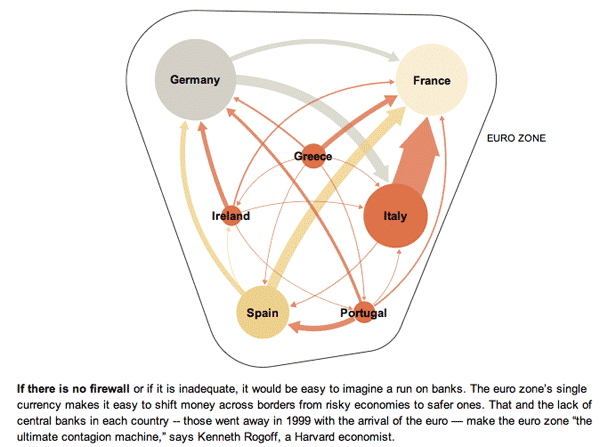
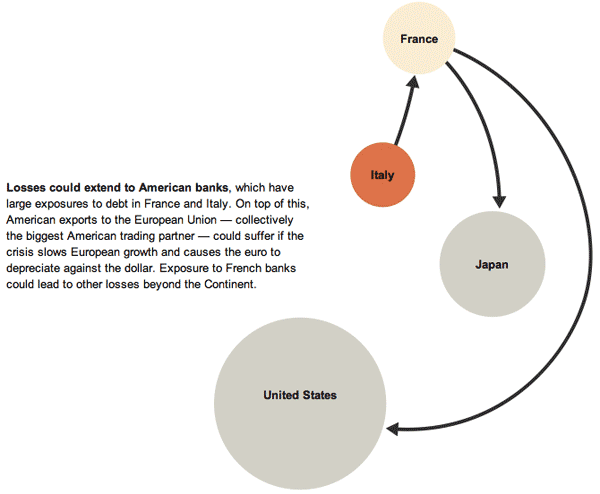
Euro Zone Debt Crisis | The Risk of Contagion
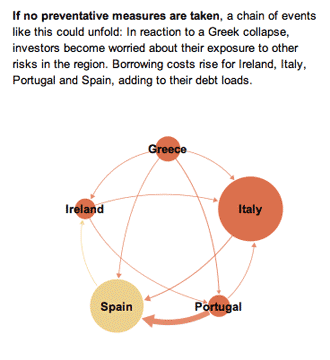
Euro Zone Debt Crisis | A possible scenario
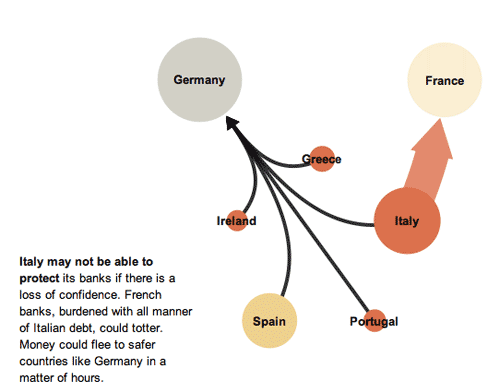
Euro Zone Debt Crisis | Continental Contagion
Euro Zone Debt Crisis | Global Reverberations

What works

This series of graphics by the New York Times Sunday Review does an excellent job of explaining the European debt crisis in terms of the banking relationships that exist among partners within the Eurozone as well as between Eurozone members and their trading partners outside of the Eurozone. I hardly feel like commenting. The one graphic design decision I loved the most – because it is subtle and easily overlooked – is that after the overview graphic, the total size of the graphic starts small and grows larger. This mirrors the way the crisis itself develops and reinforces that element of the message visually. It would have been extremely easy to simply use the full paste-board available for each of the images in this progression. The designers decided to use the available white space to tell part of the story.

In the overview graphic, the countries that are not impacted or impacted only slightly are represented in grey. In the more detailed graphic progression, these grey elements are dropped out and represented by white space. This is a somewhat counter-intuitive move. Information graphics are supposed to be chock-full of information, right? So why would the designers *drop* countries, especially the US, when running a graphic about the global impact of the European debt crisis in an American newspaper? Because the way they are able to use white space helps drive home one of the key elements of the debt crisis – that it is so far small and could either get much bigger or stay relatively small in the coming months, depending on what steps are taken now to mitigate the rippling out of negative impacts.

What needs work

Nothing needs work. This is a great graphic.

References

Marsh, Bill. (2011, 22 October) “It’s all connected: An overview of the Euro crisis” in nytimes.com Sunday Review. Other authors/designers listed include: Xaqun G. V., Alan McClean, Archie Tse, Seth Feaster, Nelson Schwartz, and Tom Kuntz.

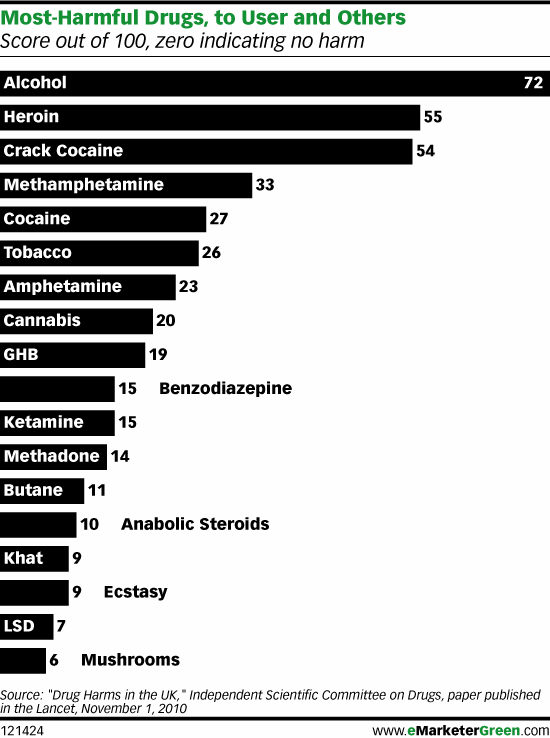
Original Version of the bar graph

How is the scoring system determined?

British researchers affiliated with the Independent Scientific Committee on Drugs met for a one day workshop and constructed a composite scoring system to determine which drugs are most harmful both to individuals and to society collectively. Scores can range from 0 – 100. Authors David Nutt, Leslie King and Lawrence Phillips found that,

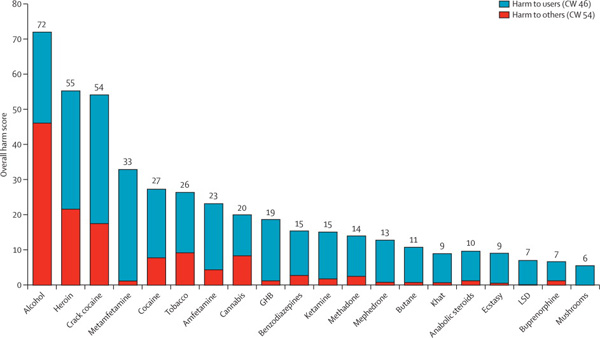
heroin, crack cocaine, and metamfetamine were the most harmful drugs to individuals (part scores 34, 37, and 32, respectively), whereas alcohol, heroin, and crack cocaine were the most harmful to others (46, 21, and 17, respectively). Overall, alcohol was the most harmful drug (overall harm score 72), with heroin (55) and crack cocaine (54) in second and third places.

The full list of factors that were included in the composite score are here:

  • Mortality
  • Damage
  • Dependence
  • Impairment of mental functioning
  • Loss of tangibles
  • Loss of relationships
  • Injuries to others
  • Crime increase
  • Environmental degradation
  • Family breakdowns
  • International turmoil
  • Economic cost
  • Loss of community cohesion and reputation

Though it is possible to go into an explanation of how each of these was measured and subsequently combined to produce the composite scores, I am going to leave that discussion to the authors of the original study. There’s an overview graph below and the full article Drug Harms in the UK: A multi-criteria decision analysis is at the Lancet.

Composite scores showing contributions from harm to individuals and harm to society

What can be done?

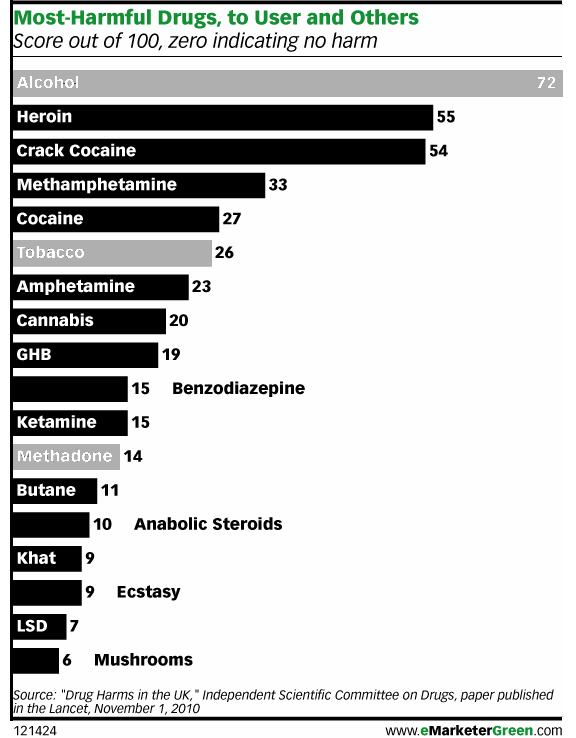
I found it interesting that there was no attempt made to distinguish between legal and illegal drugs. Yes, of course, some drugs are not clearly legal or illegal. They are legal when prescribed and supervised by a doctor but illegal when used off-label or outside the medical authority system (like anabolic steroids, methadone, and marijuana in California). I assumed that most methadone users are under some kind of supervision but that most anabolic steroid users are using the steroids off-label (ie illegally). You can quibble with my choices below. The point here is that I found the graph to have more context if the legality issue was visually inscribed into it.

Photoshopped version of graph that highlights legal drugs

There are age limits and places where it’s illegal to smoke or drink, but for the most part everyone will be able to use alcohol and tobacco legally for most of their lives. Methadone is probably being used legally in most cases. That’s why I shaded those bars grey. I am not expert on methadone, but I see that it is much less harmful to users and to society than heroin, the drug it stands in for, so I guess if this were the only data I had to make a decision about continuing methadone treatment programs, I would keep them going. I would also call for close scrutiny of methadone programs. Something is clearly not working as well as it could be.

As for alcohol and tobacco…well…it’s hard to argue *for* the continuing legality of alcohol. How large do detriments to society have to be to trigger additional control mechanisms? The authors of the study noted that alcohol is part of society and it isn’t going anywhere. I agree. Prohibition was a failed experiment in this country and I’m not suggested we try it again. However, I would like to reopen the debate about how the negative impacts of alcohol can be alleviated. I recommend that all new cars must have breathalyzers in them. If the driver cannot blow a legal sample, the car won’t start. Yes, people could game that system by having their friends blow for them, but often one’s friends are also drunk. And hopefully, friends really wouldn’t let their friends drive drunk. Once upon a time, seatbelts were considered extraneous and seatbelt laws were considered constraints upon American’s rights to freedom and the pursuit of happiness. Well, when a drunk driver kills one of your family members, you might decide that the sudden loss of your mother or son or niece puts a much bigger crimp in your pursuit of happiness than a breathalyzer in your car ever would have. Will breathalyzers make cars cost more? Probably. But the cost of dealing with car accidents caused by drunken driving, even when they aren’t fatal, is absorbed by random individuals who happened to be in the wrong place/time as well as tax payers who pay to repair guard rails, subsidize public hospitals and EMTs, pay cops’ salaries, and so on.

References

Nutt, David J, Leslie A King, and Lawrence D Phillips. (6 November 2010) “Drug harms in the UK: a multicriteria decision analysis” The Lancet, Vol 376(9752): 1558 – 1565.

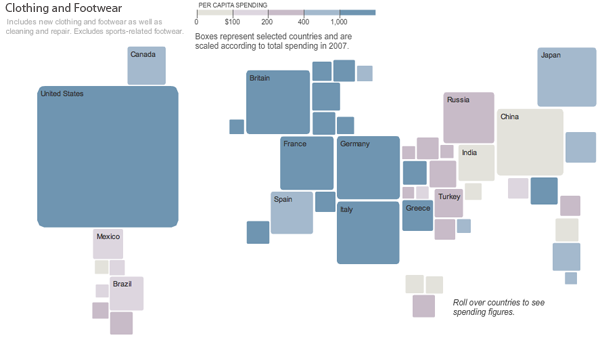
Clothing and Footwear, Global Spending 2007

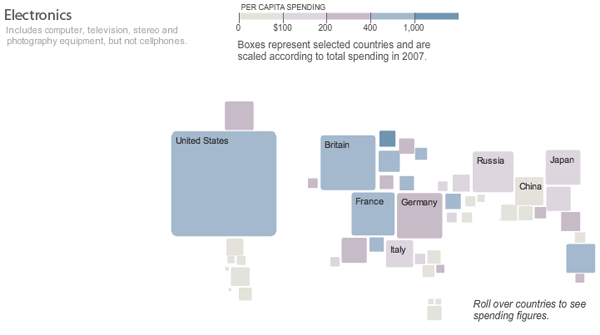
Electronics, Global Spending 2007

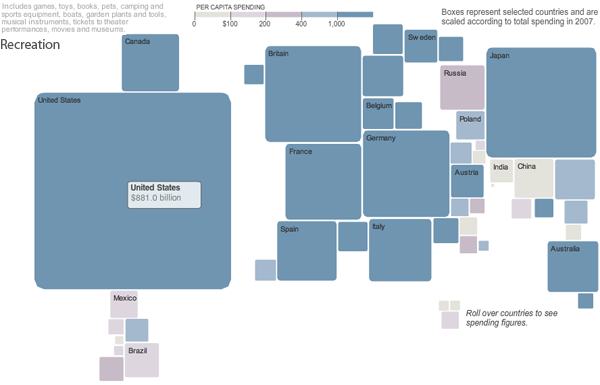
Recreation, Global Spending 2007

What Works

I have been thinking about other ways to work with maps lately, and I stumbled upon this interactive consumption map created by the folks at the New York Times using numbers from Euromonitor International, 2007. This graph was certainly a product of a moment in time – I don’t see too many people making consumption graphs like this one these days. They might be making line graphs where the total amount of consumer spending or consumer confidence is of immense concern to finance people who are eager for the next growth period in the economy. (I’m not saying that only finance people are looking forward to economic growth, just suggesting that they are the people who spend a lot of time studying consumer behavior as they anticipate the growth period. The rest of us might be looking at our own retirement statements or home values or paychecks.)

This map approach to spending is great because the graphic designers – Hannah Fairfield, Elaine He and Kevin Quealy – realized that maps are just schematics. It isn’t necessary to stick with a country’s shape, but it is nice to keep them in about the same positions relative to one another. Freeing each country from the shape of its political boundaries allows each square country to change dimensions in direct relation to total consumer spending within a sector. The color tells us what this works out to in terms of per capita spending. If you clicked through to look at the actual interactive graphics you’ll find that if you mouse-over a country, you can see the dollar amount of the total spending for whatever sector you happen to be viewing.

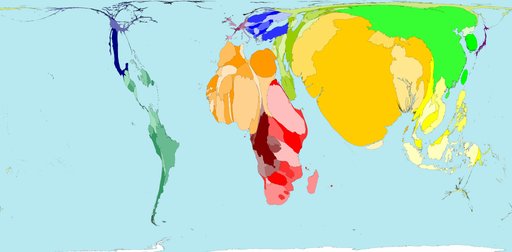
The strength of this graphic is that it strips away unnecessary detail to focus your eye’s attention on the most salient information in an easy-to-digest kind of way. This is a huge improvement over the sort of thing that I see all too often (and have included a little global poverty example here). My eye is terrible at assessing relative areas when the shapes are so irregular like this. Much better to just keep the relative positions of the countries and give them square shapes that can be quickly, effortlessly scanned for the sake of comparison.

Human Poverty
Human Poverty

What needs work

I would have put the per capita spending in the roll-over as well. Right now it’s just the country’s total spending. I also would have thought about a way to represent all the countries that don’t even make this map. Something understated and subtle – a sprinkling of grey dots? But then those countries might look like dust…still thinking about that.

The other thing I might have liked would be to have either gone completely grey scale (preferred) or to have selected a single color for each sector with increasing saturation as spending increases. The second approach would have made more sense if the product was a series of print graphics, but the approach they actually took and the grayscale approach are better for this sort of interactive graphic in which the viewer sees only one at a time.

References

Hannah Fairfield, Elaine He and Kevin Quealy. (4 Sep 2008) “What your global neighbors are buying”. Business Section of the New York Times. Using Euromonitor International figures.

Fairfield, Hannah. (4 Sep 2008) Guccis or Gadgets? Business Section of the New York Times. [related article that ran with the graphic]

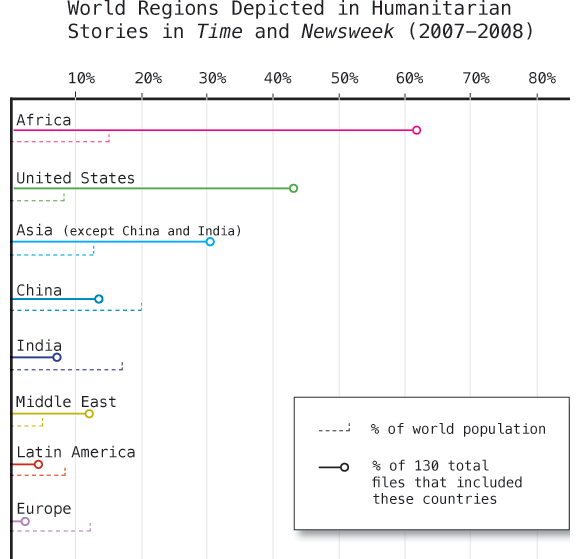
Infographic Humanitarian images in Time and Newsweek

An Original Creation – Draft Only

Jen Telesca and Nandi Dill, my fellow research assistants at the Institute for Public Knowledge, presented a paper last year based on data they gathered doing visual content analysis of Time and Newsweek during the years 2007 and 2008. They looked through each issue, identified the articles that were humanitarian in nature, and then coded those images according to geography, the type of situation depicted, and the purported status of the individuals in the image (military actor, activist, politician, celebrity, etc). I am helping create the graphics and I thought I would share this one even though it isn’t yet complete.

As per usual, I welcome your comments and criticisms with open arms. Tear it apart, but be specific.

Methods and Findings

There were a total of 130 articles containing 363 images. The above graphic is supposed to help viewers come to the realization that not all areas are equally represented. I assumed – and this is a wild leap here – that there is some baseline level of social disease and natural disaster plaguing any population. More people = more trouble though we know the relationship is imperfect. Poor areas may experience a natural disaster as a humanitarian crisis leading to orphanhood, starvation, lack of adequate food and shelter where another region would have experienced the same natural disaster as a major inconvenience but one that insurance policies would more or less cover. A natural disaster does not always become a humanitarian disaster. Variables like wealth, racism, literacy, and so forth do play a role and I cannot capture those elements by showing a simple population statistic.

Am I forgetting something major? Am I taking Time and Newsweek to be tellers of the truth, representers of the world as it is, completely objective and unbiased by budgetary constraints or political agendas? Not really. I’m also not trying to push those issues too hard. One could assume from this graphic that some regions are more likely to be represented as suffering from (or aiding in the recovery from) humanitarian emergencies than others for reasons that have nothing to do with the frequency of these kinds of emergencies.

I hope that the graphic leads you to wonder why some regions appear more frequently than others but that it does not beat you over the head with the claim that Time and Newsweek like to depict Africa and the Middle East as sufferers and the US as altruistic helpers far more than a random sample of suffering or aid giving would indicate. Just look at Europe. They appear neither to suffer from or aid in humanitarian crises much compared to how many people live there. One theory is that US based magazines prefer to show US citizens performing acts of altruistic heroism rather than showing Europeans lending a hand. To what degree is Africa over represented because there are simply more humanitarian emergencies there versus being over represented in images because in this particular moment, in these two magazines, Africa equates well with the typical imagination of victimhood?

The graphic cannot answer all those questions. Mostly it just intends to raise them. What do you think?

Please send me comments

I will post the next draft when it is ready. I’ll tell you right now that it will include an indication of how often impending or ongoing crises were associated with each region. That should make it easier to tell which geographies are shown to be full of victims and which are full of altruists.

[There is a future graphic that uses the same dataset to show that being a victim and being an altruist are more or less mutually exclusive. For instance, stories involving crises in Africa almost never show Africans helping Africans. Instead, folks from wealthy countries are usually the ones depicted doing the helping.]

Infographics News header
Infographics News

Reading suggestion

I came across a blog that was new to me, all about information graphics with a Euro-slant, though the New York Times is still well-represented. The writer is Chiqui Estaban out of Madrid and somewhat heroically, he posts in English and Castellano. If you can read Spanish, I recommend that version because the English isn’t perfect. But then again, if you are reading this blog, you understand the value of a good image to communicate clearly, so hopefully you can look beyond a few errors in grammar.

Digressive Thought About English on the Interwebs

The fact that Sr. Esteban publishes in not only his native language but also in English makes me wonder if it is time for one of the contexts blogs to start a discussion about the primacy of English online. It’s harder to detect if English is your native tongue, but in other places, making a website requires knowing another language, hiring a translator, or using google translate (or Yahoo!s Babel Fish, etc.). And for a blog that is posted everyday, that is tedious (and therefore, may not happen). There is a much larger conversation here. English speakers have hidden privileges online (borrowing and repurposing that term from Lipsitz) that make their e-productions more international than they likely know.

References

Esteban, Chiqui. Infographic News.

Lipsitz, George. (1998) “The Possessive Investment in Whiteness”. Temple University Press.

España Gastos Estados

Espana Gastos Estado
Espana Gastos Estado (2008) | Publico.es

What works

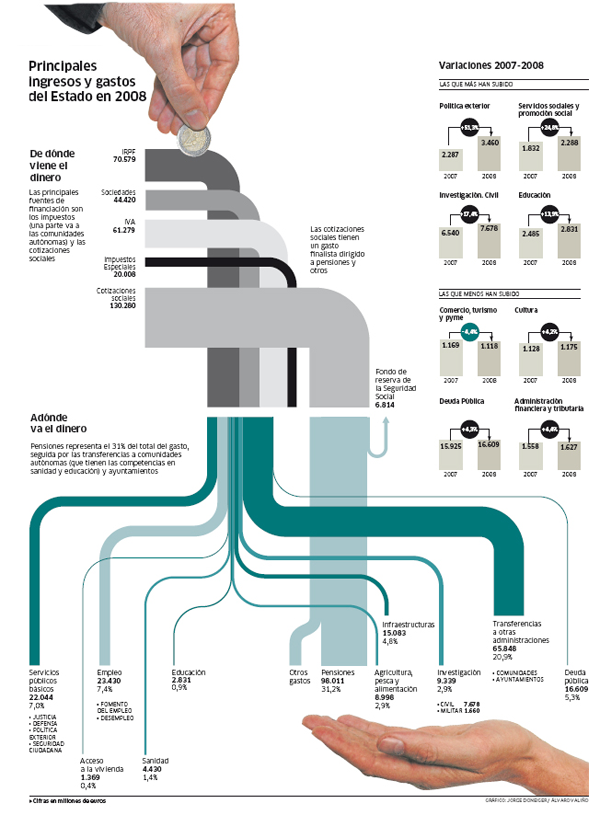
The point of the graphic is to show how funds flow – money in, money out. Now, we have seen this kind of thing before, but here I just want to point out that in cases where the flow of a quantity is the point of the graphic, there are some benefits to abandoning the graph format. Just try to imagine this as a bar graph. It’s easy enough. Instead of flows orienting themselves at right angles and looping arrows, they just straighten, assume the same width, and grow to varying heights. Flows in could be black, flows out could be grey (and overflows could be red!). What would be lost in a bar graph would be the sense of flow. If done cleverly, what would be gained in a bar graph would be the ease of comparing the size of in-flow to the size of out-flow.

Another benefit of this graphic is that it becomes obvious that information graphics can cross international boundaries with greater ease than, say, the same information written out in a report. My Spanish is improving, but I still could not make it through a report on the budget. I can, however, stumble through this information graphic.

What needs work

Here, it is difficult to sense, without doing mental math using the numbers provided, how in-flows compare to out-flows. I’m also a little confused about why some flows fall into the hand, and others terminate outside the hand. I would think education, sanitation, basic public services, housing services, and employment services would be the kinds of things flowing into the public hand. Research and transfers to other administrations, not so much. Pensions, yes, they should go to the hand and they do.

What do you think of the hands? As an aesthetic device, I’m not sure I like them at all. As a device to segregate categories of spending into those that are more directly aiding the public and those that are swirling around in a more internal fashion – research dollars going to schools, institutes, and the military which are primarily funded by the government are pseudo internal – I could support that. I just don’t think it was done correctly here.

References

publico.es (2008) “Espana Gastos Estados” [graphic by Jorge Doneger and Alvaro Valiño]

Second Trimester 2010 Rental Prices in Madrid
Second Trimester 2010 Rental Prices in Madrid | idealista.com

What works

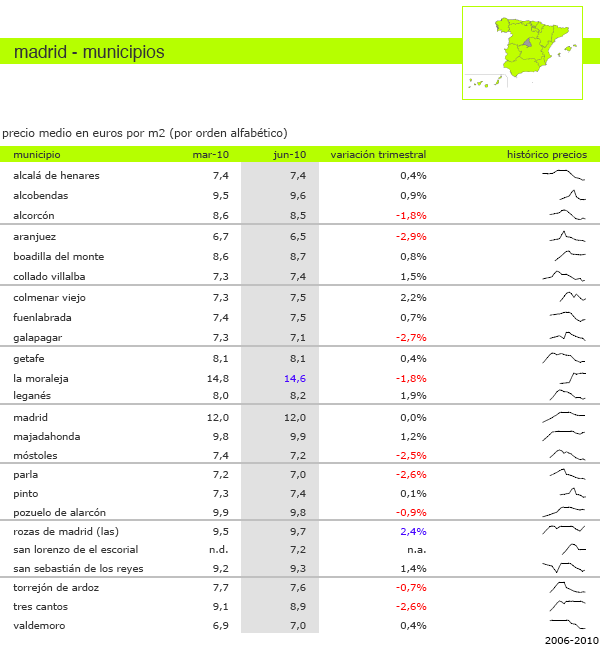
This idea is so simple and demonstrates the reason tables are great as well as the reason trend lines are great. In general, tables are capable of organizing more information than most information graphics. Sure, you can have small 2×2 tables but there can also be tables that go on almost to infinity (or so it seems if you are asked to turn them into an information graphic). But tables are extremely flexible and this is just one simple example of how they can accommodate trend lines.

The folks at idealista.com prepared a report covering second trimester rental prices in Spain and above you can see what has been going on in the neighborhoods of Madrid. They include the numbers as well as trend lines that demonstrate in a glance the recent history of prices in those neighborhoods. It isn’t rocket science to stick those trend lines right in the table, but it is useful. This should also remind all of us that trend lines are legible even when they are very small.

What needs work

Those trend lines need at least a start date and an end date. It is tempting to think that they start at the beginning of the trimester and end of at the end of that trimester but it is unclear (and unlikely, in my opinion). Plus, some of the trend lines seem to start up in the middle rather than at the beginning.

Rental prices in Spain – 2010

In case you came to this blog because you are, in fact, concerned about housing rental prices in Spain, here’s a summary of the report. While there have been statistically significant but small price changes in some markets, in Madrid and Barcelona, rents are basically holding steady.

References

idealista.com (2010 16 July) Evolución del precio de la vivienda en alquiler [Rental housing price report]

European football revenues, 2008-08 | The Economist

What works

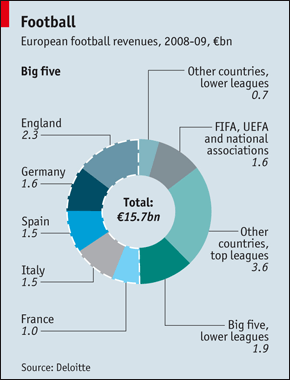
This is not my favorite graph (donuts, pie charts, any graph named after a pastry seems doomed to be difficult to digest). Having trouble finding much to like, except that it is about the economics of a current event, which adds a data-driven contextual angle to a cultural event. That part I like.

What needs work

The text accompanying this graph points out that, “Most of the money coming in from television, tickets and so forth goes out in wages. Deloitte says that only two of the big five, Germany’s Bundesliga and the English Premier League, operate at a profit.” However, the graph doesn’t give any indication of profit, only of revenue. It also doesn’t explain where the revenue comes from and goes to, which leaves this infographic horribly flat.

Further, reading these donut things, the next generation of the hated pie graphs, is visually difficult. Bar graphs would have been better. At least they included the numbers so we can forget looking at the graphic and just compare the numbers.

References

The Economist. (10 June 2010) “Football”.