Sex Scenes of Male Novelists: A Generational Comparison | Paula ScherMale Authors and Sex-Differing Generational Attitudes and Attributes | Paula Scher
Katie Roiphe wrote an excellent article – “The Naked and the Conflicted” – in the New York Times that tracks the treatment of sex by male novelists from writers like Norman Mailer, Philip Roth, and John Updike through to contemporary writers like Jonathan Franzen, Michael Chabon, and Benjamin Kunkel. The upshot is that newer male novelists do not include the exuberant, even extreme, sex that got previous male novelists in trouble, but at least made them interesting. The younger writers’ sex scenes involve a lot more cuddling if they have any sex scenes at all. It’s a good article, I recommend that you read it.
What works
I really like that an article about novels and plots – not something that easily lends itself to information graphics – includes not one, but two different visualizations. I also happen to like that they are magenta. It’s a story about sex – magenta is a good way to scream for attention.
What needs work
I don’t know about you, but these are probably only good as jokes. And joking with information graphics is just fine by me. I encourage it.
If one were to try to interpret these as graphics, though, I have a few recommendations. First, I would have ordered the authors in the same way on both visualizations. Right now they are mirror images and it makes it harder to follow the patterns. I think the graphic could have been funnier and more helpful if there had been an axis labeled with what constitutes sex, more sex, outrageous behavior. If you read the article, some of this becomes clear, but the graphic doesn’t stand on its own without the article. And the snake-y graphic just doesn’t do much at all. There is no reason for all the snakiness – just makes it hard to read which obscures the point. It might have even been funnier if each of the adjectives had been in its own bubble where the size of the bubble increased the more authors that could be described with that adjective.
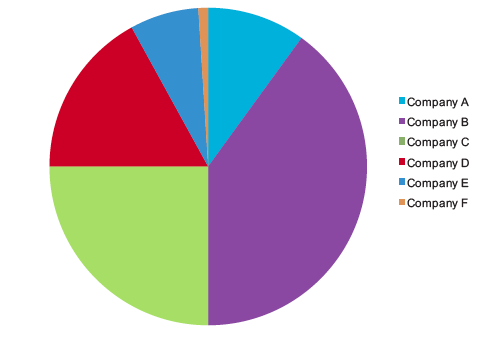
Readers, dear readers, I know my regulars are sick of hearing about how much I hate pie charts. But I came across Stephen Few’s latest newsletter – Mr. Few is a man who is a professional information graphics guru and he hates pie charts, too. Of course, he is a professional and he doesn’t use the word hate. When I saw his newsletter, a smug smile of satisfaction crossed my face and I thought to myself, “Self, maybe the readers are sick of hearing you complain about pie charts, but they might want to hear how someone else complains about them. Because: Look! He has illustrations!”.
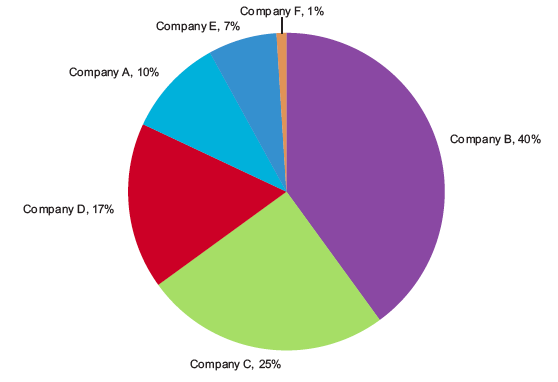
In the first pie chart, a person might be convinced that pie charts are a decent tool. Just look at how easy it is to see that the light green segment is 25%? Super easy. Without even thinking, it’s obvious, which is the mark of a good information graphic. As for the other segments…same problem as always. Most humans are not good at visually estimating rounded volumes.
See how easy it is to see the 25% segment here? | Stephen Few, Perceptual Edge
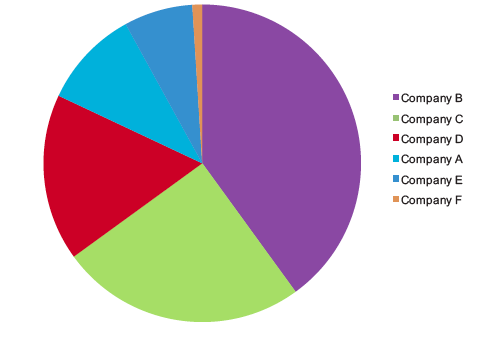
And what if we simply rotated the pie a little?
Pie chart rotated - much more difficult to estimate the size of the 25% segment
Now it is much more difficult to get a quick visual estimate of any of the segments, even the 25% piece and all Mr. Few did was rotate the pie. Mr. Few notes that when people use software to generate pies like this, they have little control over what piece of the pie ends up in which position. He explains that our eyes have very few visual metaphors for segmented circles, one of which is the clock: “In the earlier example, our ability to decode the green slice at 25% was assisted by the fact that the green slice began at the 6 o’clock position and extended neatly to the 9 o’clock position.”
Perhaps we solve the problem by just sticking the numerical value right near the slices of pie? He does that and then adds another layer saying, “Why stop here? ….We can solve this problem by directly labeling the slices with both the company names and the values…” which leads to this graphic:
Overly labeled pie charts | Stephen Few
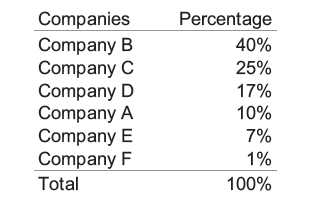
But that leads him to a conclusion that I support which is that this information is much easier on the eye if it’s just in a simple table. The pie itself just confuses things.
Turning the pie into a table | Stephen Few
Much clearer in a table, no? I think so. And so does Mr. Few.
I came across a blog that was new to me, all about information graphics with a Euro-slant, though the New York Times is still well-represented. The writer is Chiqui Estaban out of Madrid and somewhat heroically, he posts in English and Castellano. If you can read Spanish, I recommend that version because the English isn’t perfect. But then again, if you are reading this blog, you understand the value of a good image to communicate clearly, so hopefully you can look beyond a few errors in grammar.
Digressive Thought About English on the Interwebs
The fact that Sr. Esteban publishes in not only his native language but also in English makes me wonder if it is time for one of the contexts blogs to start a discussion about the primacy of English online. It’s harder to detect if English is your native tongue, but in other places, making a website requires knowing another language, hiring a translator, or using google translate (or Yahoo!s Babel Fish, etc.). And for a blog that is posted everyday, that is tedious (and therefore, may not happen). There is a much larger conversation here. English speakers have hidden privileges online (borrowing and repurposing that term from Lipsitz) that make their e-productions more international than they likely know.
The point of the graphic is to show how funds flow – money in, money out. Now, we have seen this kind of thing before, but here I just want to point out that in cases where the flow of a quantity is the point of the graphic, there are some benefits to abandoning the graph format. Just try to imagine this as a bar graph. It’s easy enough. Instead of flows orienting themselves at right angles and looping arrows, they just straighten, assume the same width, and grow to varying heights. Flows in could be black, flows out could be grey (and overflows could be red!). What would be lost in a bar graph would be the sense of flow. If done cleverly, what would be gained in a bar graph would be the ease of comparing the size of in-flow to the size of out-flow.
Another benefit of this graphic is that it becomes obvious that information graphics can cross international boundaries with greater ease than, say, the same information written out in a report. My Spanish is improving, but I still could not make it through a report on the budget. I can, however, stumble through this information graphic.
What needs work
Here, it is difficult to sense, without doing mental math using the numbers provided, how in-flows compare to out-flows. I’m also a little confused about why some flows fall into the hand, and others terminate outside the hand. I would think education, sanitation, basic public services, housing services, and employment services would be the kinds of things flowing into the public hand. Research and transfers to other administrations, not so much. Pensions, yes, they should go to the hand and they do.
What do you think of the hands? As an aesthetic device, I’m not sure I like them at all. As a device to segregate categories of spending into those that are more directly aiding the public and those that are swirling around in a more internal fashion – research dollars going to schools, institutes, and the military which are primarily funded by the government are pseudo internal – I could support that. I just don’t think it was done correctly here.
References
publico.es (2008) “Espana Gastos Estados” [graphic by Jorge Doneger and Alvaro Valiño]
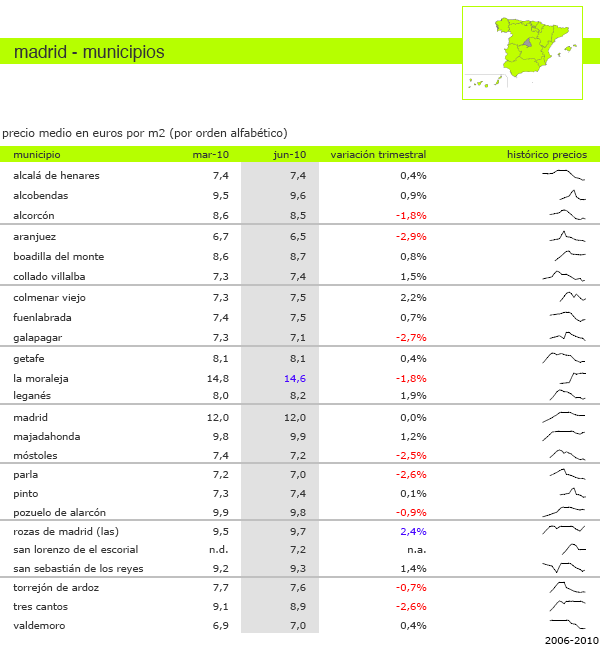
Second Trimester 2010 Rental Prices in Madrid | idealista.com
What works
This idea is so simple and demonstrates the reason tables are great as well as the reason trend lines are great. In general, tables are capable of organizing more information than most information graphics. Sure, you can have small 2×2 tables but there can also be tables that go on almost to infinity (or so it seems if you are asked to turn them into an information graphic). But tables are extremely flexible and this is just one simple example of how they can accommodate trend lines.
The folks at idealista.com prepared a report covering second trimester rental prices in Spain and above you can see what has been going on in the neighborhoods of Madrid. They include the numbers as well as trend lines that demonstrate in a glance the recent history of prices in those neighborhoods. It isn’t rocket science to stick those trend lines right in the table, but it is useful. This should also remind all of us that trend lines are legible even when they are very small.
What needs work
Those trend lines need at least a start date and an end date. It is tempting to think that they start at the beginning of the trimester and end of at the end of that trimester but it is unclear (and unlikely, in my opinion). Plus, some of the trend lines seem to start up in the middle rather than at the beginning.
Rental prices in Spain – 2010
In case you came to this blog because you are, in fact, concerned about housing rental prices in Spain, here’s a summary of the report. While there have been statistically significant but small price changes in some markets, in Madrid and Barcelona, rents are basically holding steady.
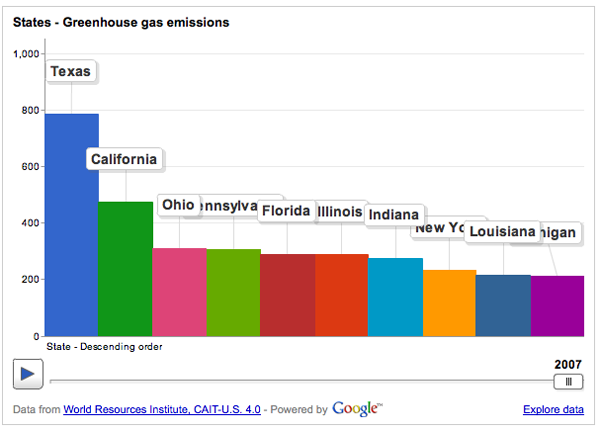
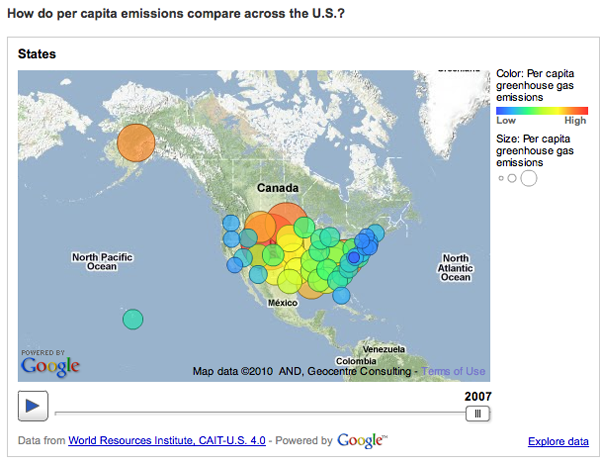
Greenhouse gas emissions | World Resource Institue and Google's Public Data Explorer
What works
The World Resource Institute has partnered with Google to create an interactive portal for creating visualizations based on publicly available data. Google has been in the business of doing this sort of thing at least since the time they acquired Trendalyzer from Scottish-based gapminder.org in 2007. To be sure, gapminder.org is still a going concern of its own and IBM also offers free web-based visualization services through their Many Eyes program.
The focus of the trendalyzer is to show change over time and they succeed in making it quite easy to watch panel data change over time.
What needs work
BUT…I find that this particular graphic is a great example of a misleading reliance on time as the key ‘context’ variable. So the graphic above breaks down greenhouse gas emissions by US state over the course of the year. If you have already clicked over to the World Resource Institute and watched the animation of these bars pumping up and down (more up than down) and trading places with each other over time, you will surely have been fascinated. I watched it three times in a row. But I was stuck wondering what the take away was meant to be. Clearly, there is the first order take away that the bars pretty much grow over time, they do not shrink. If I were the World Resource Institute, getting that message out would be important to me. But I would hope for more than just the bullhorn approach, “More is BAD! More is BAD!” which is kind of how this hits me at the moment.
One of the biggest problems with this graphic is: not all US states are the same size. Of course Texas emits more greenhouse gases than most states – many more people live there than in, say, Kentucky, Iowa, Oregon, etc. But the World Resource Institute chose to display per capita emissions with the bubble approach (which has almost no redeeming value in my opinion because I cannot even see half of the bubbles. Maybe they all could have been reduced by half or more? And maybe instead of going with colors on a spectrum, the worst could have been red, the best could have been green, and most everyone else could have been some shade of grey? It’s just not possible to hold 50 changing variables in your active cognitive space at once. Reducing it to three variables – the good, the bad and the mediocre – could actually increase retention and pattern recognition.)
Greenhouse Gas Emissions Per Capita, US 2007 | World Resource Institute and Google
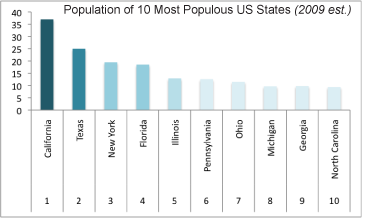
But back to the bar graph at the top. For the purposes of greenhouse gas emissions, it makes the most sense to interpret size as population not square miles, so that’s what I am going to do. In an attempt to be helpful, I threw together a bar graph of the top 10 most populous US states (using 2009 population estimates) in good old Excel. Note that our friend Texas is not the most populous state by about 12 million people – that is a lot of people. California is the biggest and they emit way less than Texas. New York is the third most populous state and we emit far less than our proportional share would suggest. Let’s hope it stays that way because I already find it unpleasant to breathe the air in Manhattan (admittedly, that could be due to many causes besides greenhouse gas emissions).
Most populous US states by size
My suggestion here is clear: prepare a bar graph per state, per capita. And, yes, I would want to see how that changes over time. I would probably watch the animation six times instead of three times. My fantasy is that we could compare not necessarily by state, because that is in many ways arbitrary, but by personal habits. Say we get the most extreme environmentalists – vegan, freegan, won’t even take motorized public transportation, never flies, prefers candles to compact fluorescents, has a composting toilet – to the somewhat average person who has a car but not an SUV, eats meat but not every day, does not pay more for organic food – to the extreme non-environmentalist who owns three houses, drives in an Escalade or something of that nature, flies internationally at least four times a year, pays extra for organic food (but at restaurants), and sends clothes to the dry cleaners twice a week. But that would probably result in a graphic best described as “info-porn”, enticing and exciting but intellectually vacuous.
Summary
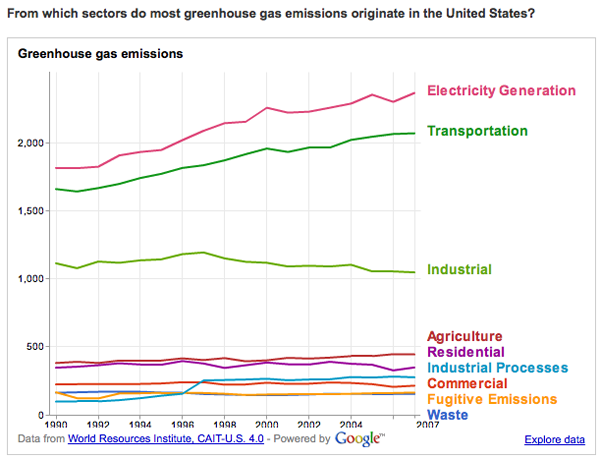
The WRI is on to something with their Google partnership. My favorite of their early work is this line graph that does a better job of telling the emissions story than any data broken down by state.
Greenhouse Gas Origins | World Resource Institute and Google
But the other great thing about the new partnership is that they ask for suggestions and set up a google group to manage the roll-out and incorporate nay-sayers like myself.
“By pairing [the Climate Analysis Indicators Tool] CAIT data with Google’s tools, there are new possibilities for people everywhere to take part in using sound data to tell stories that frame environmental problems and solutions. In the future, we hope to include additional data sets that can tell even more stories through Google’s visualization tools.
Suggestions for what you would like to see, or have a question about CAIT-U.S. data? Let us know here or join the conversation at http://groups.google.com/group/climate-analysis-indicators-tool.”
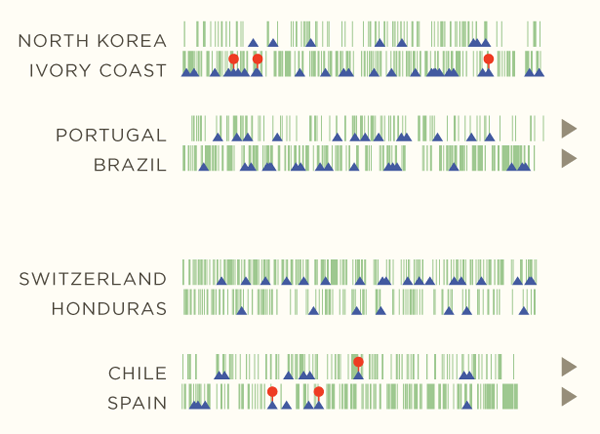
Diagram of a World Cup Game | Michael Deal, Umbro Blog
What works
Right on, no? I think so. This comes to us from the Umbro blog where a much bigger version is available, designed by Michael Deal.
This graphic simplifies a match into completed passes, shots on goal, and completed goals. Each completed pass gets a thin green bar – no difference for the length of the pass (good decision, Michael) – which has the visual impact of displaying possession across the course of the game. And we all know how important possession is. Then the blue triangles show shots on goal and the red balloons show us where goals are made. The success of this graphic is a result of the simplification – we have only three channels of information – possession, shots on goal, goals. There was no attempt to break the team down into its constituent members, which was probably the most important decision. There was also no attempt to do much with numbers – no percentage of time under possession, no counting up all shots on goal, no display of penalties in any way.
Before I forget, this is a time line. The main organizing axis is time. In fact, the only organizing axis is time. There was no attempt to represent space. Great decision because representing space – like some map of the field – would have muddied up the message beyond recognition. Take home point: when the goal is to show change over time, just stick to time and leave space out of it. We all know what the soccer field looks like and we all know that it’s hard to take a shot on goal from far away.
To the right of the graphic proper, the little grey triangles show which teams moved on from the round of 16.
What needs work
For the football neophytes, I would have loved to see a small number where the little grey triangle appears (except for every game played by every team) that showed how many points the team racked up during that match. In the first round, I know lots of US fans had trouble figuring out the round robin scoring system all added up. And even if you are totally familiar with the rules of the scoring system, it got to be difficult to play out all the hypotheticals – I happened to be sitting in a room full of MIT PhD students during one of the early Germany games that was being played at the same time as a critical match in the same group. There were many, many hypothetical outcomes accruing different scores in group play that had to be imagined and added up in order to understand Germany’s chance of moving into the round of 16. Sorting them all out was not easy, not even for ten MIT PhD candidates. Having a little chart that at least kept clear which points had already been earned would have been useful.
On representing space
I know I said Deal didn’t need to represent space because the point was to show change over time. However, I had some thoughts about how he might have been able to represent space in football-centric ways that would not have cluttered up the simplicity of the visual.
If the length of the passes were represented by the length of the green bars (maybe in a 4-step range progression), would we have been able to detect differences in styles of play from one team to the next? Or from one time period during the game to the next? I know that this would have added much more time during the creation of the graphic without increasing the value all that much. But it would have been one way to give each team a little specificity. Right now, the only way we know which team is which is by looking at the names. If, say, one happened to know that Spain plays a short game, then we might have been able to recognize the Spanish-ness of a time line full of short green bars.
One other thought on representing space, shots on goal from inside and outside the box could have been rendered in different saturation levels of the same color. Keeps things simple but adds depth to the information displayed.
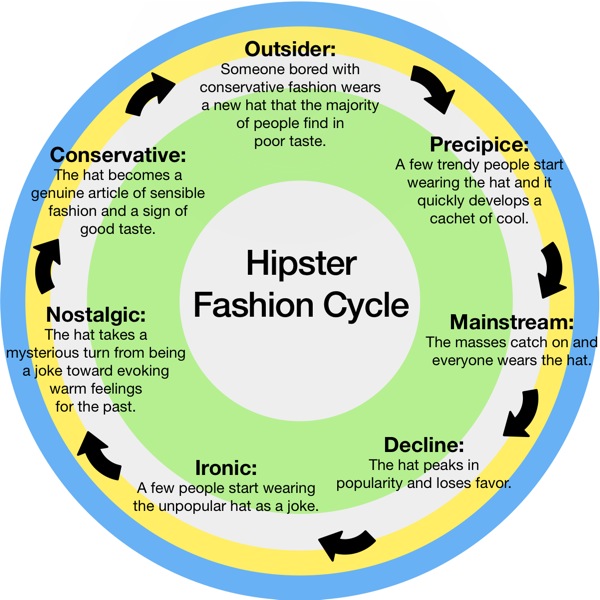
Compare this graphic to the post via Wired about new data-mining research methods shortening the time to market for new drugs. Both employ a more or less circular timeline. This one works because it is meant to discuss a proper cycle – the same hat is seen through a sort of fashion kaleidoscope of attitudes but the hat doesn’t change and the attitudes follow a more or less predictable pattern that is cyclical, not linear.
What needs work
I was expecting more hipster sensibility in the graphic – maybe a discussion about the ironic use of emoticons. The oblique reference to trucker hats didn’t quite do it for me because I spent the whole time wondering if I was wrong about trucker hats and she really meant fedoras. A bit of hipster fashion signposting would have been useful. For example, are super skinny jeans for young men mainstream cool or ironically cool or not at all cool any more among hipsters?
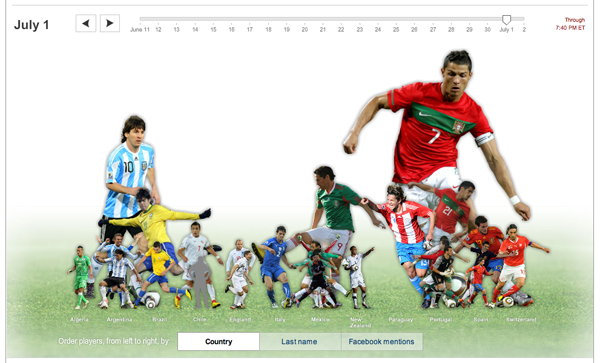
What facebook has to say about the World Cup | New York Times interactive graphic
What works
This is really fun to play with and technically sophisticated. Move the slider around the the image of the players grow and shrink relative to their mentions on facebook that day. Hold the mouse over a player and it will tell you their name, what country they play for, and the percentage of facebook wall posts in which they were mentioned that day.
Try it. You’ll like it.
What needs work
Of course, I lament the fact that so much time and effort is devoted to sport when it could be devoted to making similarly complex graphics about social science topics. On the other hand, I am somewhat glad that social scientists aren’t using facebook wall posts as evidence. Sure, they are useful within the realm of facebook, but even this example amply demonstrates that facebook is not holding a mirror up to the “real world”. (I believe facebook to be part of the real world, not a mirror of the real world. As such, it cannot be taken to contain some kind of 1:1 relationship with the rest of our experience, if only we can use bigger processors and more sophisticated techniques to analyze the steady flow of new data.)
I wonder how the mentions of individual players matches up with viewership information. While we’re wondering about that, I’d also add the wonder that the World Cup has inspired collective watching like nothing I can think of besides the Super Bowl and the World Series. Bars in Manhattan can barely contain all the people who want to watch. And people are watching on their computers (thanks univision!) at work. How does Nielsen deal with that? Will we ever have more or less accurate information about how many people watched the 2010 World Cup? Besides advertisers, does anyone care about how many of us watched this? (Personally, I’m curious to see the demographic breakdown of who watched – seems to skew quite young as far as sporting events go.)
Important note
Viva España!
But I won’t be posting to facebook about their match tomorrow because I’ll be too busy watching it. And then celebrating their win.
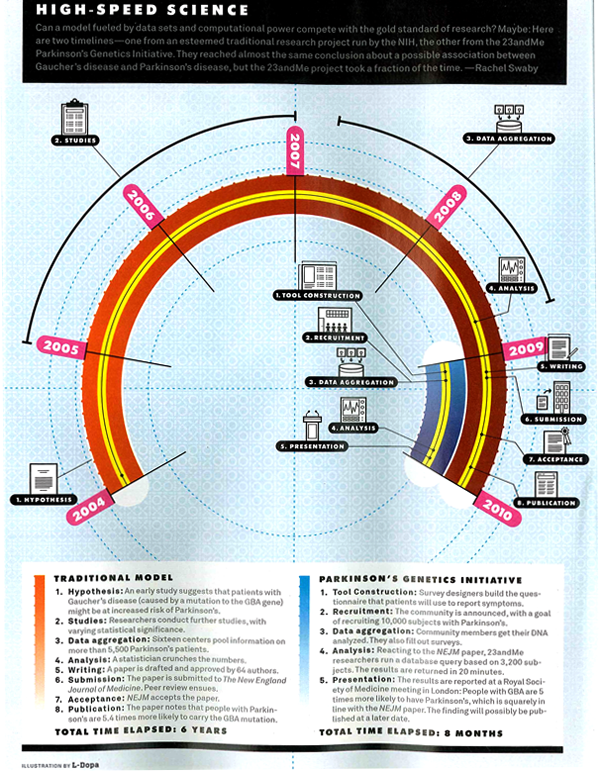
Getting drugs to market faster | Wired Magazine May 2010
What works
I am not a huge fan of this graphic though I admit it works better in print than it does in this crappy scan of the print article. My apologies. Click through here for a crisp version.
In summary, the article is about the way that research is done in the presence of many more data points (specifically, complete DNA maps of numerous individuals) and much more processing capacity. They argue using a case study revolving around the personal story of Sergey Brin who is at risk of developing the as-yet-untreatable Parkison’s disease, that data mining means research will progress much faster with no loss of accuracy over traditional research methods. They use a medical research case so they get to conclude that moving to data mining will mean people who might have died waiting around for some peer review committee (or other tedious component of double-blind research methodology) will live. Hallelujah for data mining!
They summarize their happiness in this Punky Brewster of a timeline.
What needs work
First, why did the art director order a timeline and not a diagram about how the assumptions underlying the research method have changed? It is clear that the article is taking a stand that the new research methods are better because they are faster and, in the case of Parkinson’s, could save lives by speeding things up. That is undoubtedly true, as it would be for any disease for which we currently don’t have anything that could be referred to as a “cure”. However, as a skeptical sort of reader, I find it difficult to simply believe that the new data-mining variety research is always going to come up with such a similar result – “people with Parkinson’s are 5.4 times more likely to carry the GBA mutation” (hypothesis driven method) vs. “people with Parkinson’s are 5 times more likely to carry the GBA mutation” (data-mining method). If the article is about research methods, which is ostensibly what it claims. However, featuring the chosen cause of e-world celebrity Sergey Brin could indicate that Wired doesn’t so much care about changing research methods as it cares about selling magazines via celeb power. Fair enough. It’s kind of like when Newsweek runs a cover story about AIDS in Africa accompanied by a picture of Angelina Jolie cradling a thin African child. Are we talking about the issue or the celebrity? In this particular article, it seems to me that if the core message were to focus appropriately on the method, the graphic could have depicted all of the costs and benefits of each research model. The traditional model is slower but it makes more conservative assumptions and subjects all findings to a great deal of peer review which offers fairly robust protection against fallacies of type 1 and type 2 (ie it protects us from rejecting a true hypothesis as false and accepting a false hypothesis as true). In the data mining scenario, since the process begins not with a hypothesis but with the design of a tool, there are reasons to believe that we may be more likely to run into trouble by designing tools that too narrowly define the problem. A graphic describing just how these tools are constructed and where the analogous checks and balances come in – where are the peer reviewers? What is the hypothesis? How do data-miners, who start by developing tools to extract data rather than hypotheses in line with the current literature, make sure they aren’t prematurely narrowing their vision so much that they only end up collecting context-free data (which is basically useless in my opinion)?
Don’t get me wrong, I am excited by the vast quantities of data that are both available and easy to analyze on desk top computers (even more can be done on big work stations and so forth). Caution is in order lest we throw out all that is reliable and robust about current research methods in favor of getting to a result more quickly. We could use the traditional hypothesis driven, double-blind kind of trial procedure coupled with the power of DNA analysis and greater processing capacity. It’s somewhat unclear why we would abandon the elements of the traditional scientific method that have served us well. There is a way to integrate the advances in technology to smooth over some of our stumbling blocks from the past without reinventing the wheel.
Concerns about the graphic
My second major problem is that this graphic is one of a type commonly referred to as a ‘time line’. In this case, what we appear to have is a time line warped by a psychedelic drug. This might, in fact, be appropriate give that the article is about neurology and neuropathy. Yet, the darn thing is much harder to read in the Rainbow Brite configuration than it would be if it were, well, a line. Time. Line. And the loop back factor implies that there is going to be a repetition of the research cycle starting with the same question (or dataset) all over again. That’s sort of true – the research cycle has a repetitive quality – but it is not strictly true because hopefully the researchers will have learned enough not to ask the exact same question, following the exact same path all over again.
References
Goetz, Thomas. (July 2010) Sergey’s Story Wired Magazine.
23andme (11 March 2009) A New Approach to Research: The 23andMe Parkinson’s Disease Initiative. [This was an early announcement about this project from 23andme who offered the DNA analysis].
About Graphic Sociology
Analyzing the visual presentation of social data. Each post, Laura Norén takes a chart, table, interactive graphic or other display of sociologically relevant data and evaluates the success of the graphic. Read more…