Bill Mitchell, former dean of the school of architecture at MIT and long-time leader at MIT’s Media Lab, died Saturday at age 65. A memorial service will be held this Wednesday at 10 am at the Media Lab in Cambridge, MA.
Bill was an incredible educator, especially when it came to gifted students, and a visionary intellectual of urban space in the digital age. He wrote numerous books – Reinventing the Automobile was the most recent and I featured its graphics on this blog earlier this year. eTopia, Me++, and City of Bits made up an earlier trilogy (City of Bits was my personal favorite of those three) and before that there was The Logic of Architecture, among others. He encouraged critical thinking about visual communication, in the field of architecture and beyond.
Beautiful Visualization | Chapter 2 by Matthias Shapiro
Yesterday I posted an excerpt from Matthias Shapiro’s critique of the winning design for visualizing the federal budget. While I was reading his blog, I also happened across this free download of a chapter he wrote for a new book about information graphics. The chapter is worthwhile and covers many basic principles with illustrated examples. I haven’t seen the whole book yet. Still waiting for that day when someone decides I’m an influential blogger and sends me all the relevant new books for free. Until then, I’m happy to find free downloads like this one.
The full citation for the chapter is like this:
Shapiro, Matthias. (24 June 2010) “Once upon a stacked time series” chapter in Steele, J. and Iliinsky, N., eds. Beautiful Visualization, O’Reilly Media.
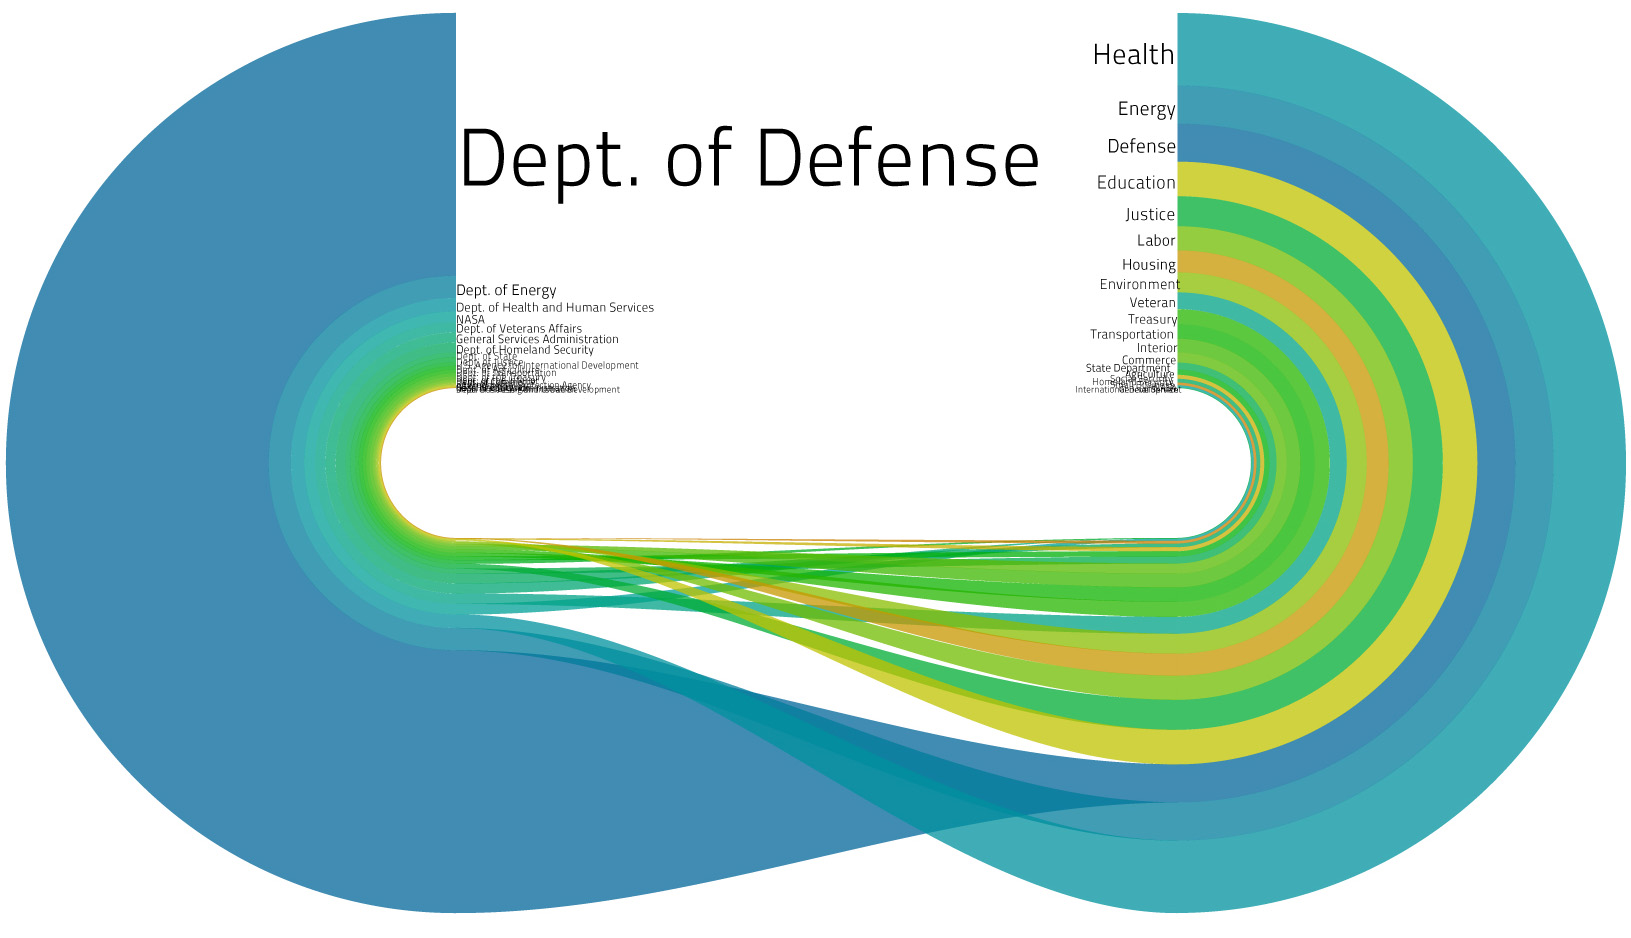
US Federal Contract Spending | Pitch Interactive for Design for America ContestAnother Iteration | Pitch Interactive for Design for America contestUS Federal Contract Spending, the straight story | Pitch Interactive for Design for America contest
What works
What I especially like about the full blog post describing the development of this graphic is that it presents multiple iterations of the same design as the designers respond to difficulties they uncovered along the way as well as criticisms from the blogging world.
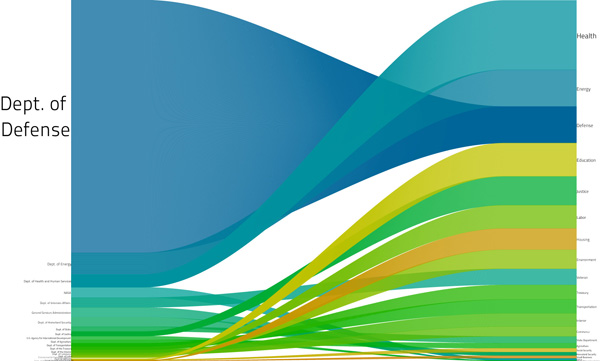
The third one, that loses the circle concept, works best for me. The labels are legible and I understand how contract spending and the media coverage (they used the New York Times, so that’s how you should interpret the term ‘media coverage’ here) of contract spending are related more clearly than in the circular version where the implication that the flow is not a simple one-way deal gets lost. And confuses things.
What needs work
Honestly, there have been plenty of criticisms of this graphic already. Rather than repeat what others have said, I’m going to introduce you to Matthias Shapiro at Political Math (a stranger to me) who has provided an intelligent critique of the above visualization series. He says,
Pitch Interactive has gotten beaten up a great deal over this visualization and they have been nothing but gracious throughout. So I just want to take a moment to say that I think their work is remarkable and that the problems with this graph are a series of very honest mistakes.
But one of the things my blog does is point out mistakes to increase understanding.
My biggest problem with the image is that it still perpetuates the stereotype that the federal government spends most of its money on defense. This image in particular drives that point home by ranking the spending areas according to their “media coverage” ranking where we can see the extent of media coverage each department saw (based on the New York Times API). “Defense” reporting is clearly out of proportion to Defense spending.
The first problem has been addressed elsewhere… it’s the issue of scaling the radius instead of the area of the circles. If the numbers were a correct representation of federal spending (more on that later), the circle visualization commits this “radius is not equal to area” visual error that really bugs me. I even gave it a couple pages in my book chapter (now available online for the low, low price of free) and mentioned it in my Microsoft talk on visualization because it is such a common mistake.
But I encourage you to click through and read his entire post. And read the entire post that Pitch Interactive wrote, too. I figure with all that reading you won’t care to slog through my opinion.
The general question, I would say, is whether or not this kind of graphic works for displaying relational data – Pitch Interactive is trying to show how fiscal data measured in dollars relates to media coverage measured in mentions in a particular newspaper. What do you think? Does it work for them? Is it a relationship we should care about? And is this kind of depiction something that will work for relating other sets of data that use different measurement scales?
Click through to get the full version or be lazy and just look at the graphic excerpt below
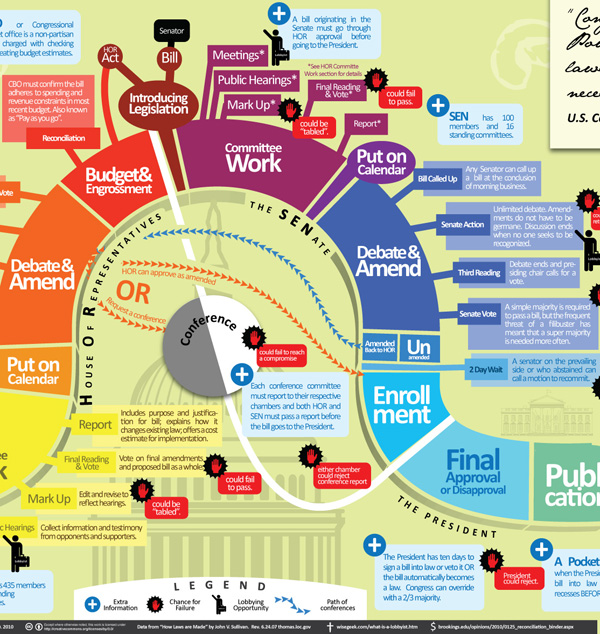
How our laws are made - excerpt | Mike Wirth
What works
My favorite part of this graphic is the inclusion of lobbyists along the way. I might have represented them with some sort of hint about the fact that lots of their power comes from money. Maybe some bills popping out of their suitcase?
Furthermore, it’s impressive that each step is so fully spelled out. Filibusters are in, as they should be.
What needs work
This is so busy. Information graphics are supposed to be relatively easy for the eye to digest. With this one, I do know where to start, but I get lost trying to follow the process along.
Here are some concrete suggestions:
Instead of gray-scaling the House of Representatives, the Senate and the President in underneath the curve, just make the segments related to the House, say, all one color, the Senate all another color, and the President a third color. To show variation within those three, play with saturation. It becomes less colorful but more intuitive.
The font sizes that vary within a segment and in the title are confusing. Just one font size per segment. This is a graphic, not a wordle. Plus, I never liked wordles. Words are mostly for writing, sometimes for labeling, but they do not make good graphics on their own with very few exceptions. Use words as words, not as graphics.
I would have tried to find a way to incorporate some of the balloons hanging off the main body into the main body. Aesthetic decision, but the whole thing looks hairy with all those balloons, lobbyist icons, kill points, and so on. Get some of that content into the segments, even if the segments have to expand to accept a bit of explanation.
I am not a fan of the buildings and whatnot sort of faded into the background. They don’t add to the story and the image is already too cluttered. Nix ’em.
The color of the conference committee – gray and white – makes it seem as though it is unrelated to the House or the Senate or anything else going on here. Maybe the members are extras from Twilight? This is actually the one place where a bit more color would have made sense. Blend the color of the HOR and the Senate and get them swirling around in conference.
The terms that are randomly defined or explained in blue boxes in what would have been ‘white space’ around the snake could have been collected and stuck into a single box somewhere. They could have been numbered and the numbers could have been applied to the graphic at the point where the viewer might have been most likely to wonder about them. Or not. With fewer than 10 terms, I think people would find their way through them without too much trouble even if they weren’t numbered and keyed directly to a particular spot on the graphic.
What needs to be said
This graphic was a winnner at Sunlight Labs Design for America contest. So all of my criticisms are, apparently, bunk. Because this one was judged to be the best of the “how the bill becomes a law” submissions. More from this design series coming soon. I can just tell you’re all getting excited about the IRS themed graphics.
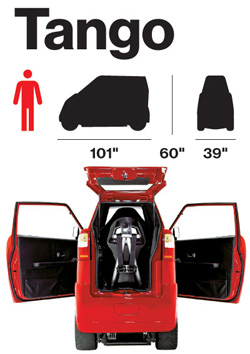
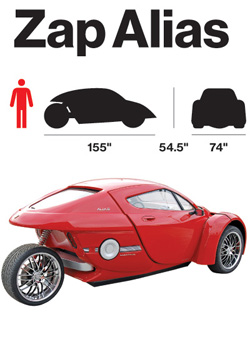
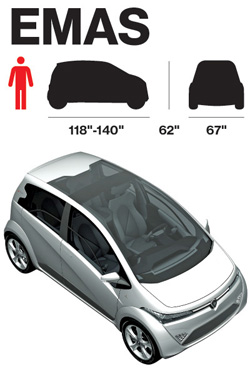
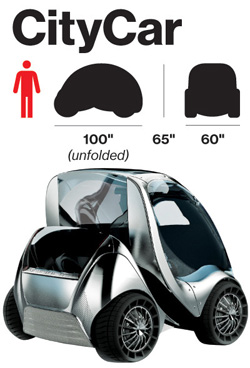
It’s nice to have the dimensions of the cars represented along with their profile and frontal massing.
What needs work
In order to make this work better, I would have put the dimensions and massing images right next to each other instead of next to the renderings/photos. It’s hard to compare when they are so distant from one another.
More important, the choice of these images to tell the story about the electric cars of the future is missing at least half the story. It continues to do for cars what we have long done for cars which is to treat them as fetishized objects. But in reality, most of the time we experience not A car, but cars as streets and highways carving up space or cars as a parking lot (either full or empty, but they always have to exist whether or not they are full at any given point in time) or cars as sources of air pollution or cars as noise. The implied message here is that because these cars are electric, at the least we shift the pollution story out of the city. But to where? We must generate electricity to run these babies and there is no hope to do that with renewable sources right now.
Furthermore, on the parking angle, these cars are smaller and will therefore take up far less space when parked. But if they have to be charged, does that mean that we will have to build new infrastructure on top of the existing parking infrastructure? Will we use the extra space not taken up by these vehicles to park bigger combustion engine vehicles? Will we have two distinct parking set-ups whereby these new cars, because they are green, get to take over sidewalk space? Or will it be something different? At the very least, I would have liked to see how many of these cars can fit in a normal parking space for, say, a Corolla as well as for a Lincoln Navigator. That would have added to the graphic.
And on pollution, I want to know if the faster models above – the Zap! – are less efficient. Generally, to go faster the car will need a bit more on board which will weigh more and thus require more batteries (which themselves weigh more). So what about relative efficiencies? [Was the Tesla left off this list for some reason?]
Also, I’m under the impression that electric cars are quieter simply because the Prius is quiet. But is that always true? I feel like I have also heard some surprisingly whiny electric scooters. Another point: can they engineer these cars of the future so that their security systems make car alarms obsolete? As far as the noise cars make is concerned, the car alarm has to be one of the worst. Every time a bus or sanitation vehicle drives by my house a car alarm goes off. And my apartment is on a bus route for two more weeks which means I am almost happy that the bus route has been eliminated due to budget shortfalls. Can’t believe I am cheering the demise of public transportation because of a pesky car alarm. But in this case, I am.
Overall, these graphics simply fail to tell the story of the future of electric cars. The change is not going to come in the fetishism of the car-as-object, but in the changing relationship between cities, suburbs, energy sourcing, and mobility.
Selling Out: How do musicians earn money online? | Information is Beautiful via Flowing Data
What works
Here’s another graphic from David McCandless atInformation is Beautiful (though I came across it when Nathan Yau wrote it up at Flowing Data) which was originally motivated by McCandless reading a piece written by independent recording artist Faza at The Cynical Musician. After the infographic hit the blogosphere, Faza ended up receiving some sort of secondhand criticism which he then countered by trying to explain what he was up to in a follow-up blog (see below for all the blogs in question).
Here’s how he described what he was originally trying to figure out:
“Most of what I write (apart from broader policy or economic issues) is aimed at the independent artist. I’m one myself, so I know the pain all too well. I know that deep down the independent artist hopes for the day when they are making enough money to be able to concentrate solely on their art.
The independent artist does not have a huge fanbase – the evolution of the Internet thus far has not changed this. The independent artist has few resources and usually cannot afford a huge marketing push. The independent artist’s financial situation largely depends on getting the most from her limited fanbase with the least expenditure possible. The biggest bang for the buck, if you will.”
This was in response to folks who pointed out that the future of the music is the past (ie live performance) or that the the profitability of music is not just in the ticket sales but the merchandise! Rightio. But Faza pointed out that for truly independent folks who do not have the resources to get out there and market themselves, going on tour and selling a bunch of tickets (and merch) probably isn’t going to happen. And, selling band t-shirts online is tougher than selling them at concerts, so the interwebs aren’t exactly making a huge difference there either.
10.000 ft view
One more thing before we get to the graphic itself. When I was fiddling with it in photoshop I realized that I had a greater appreciation of it when I started with the 10,000 foot view and then slowly zoomed in.
The colors are good. For some reason, black + some bright color is a good idea when it comes to contemporary cultural products like music and fashion. Smacks of a certain dynamism and ‘cool’ factor, which is just the spot this graphic is aiming to hit. Of course, the black + bright color = cultural cool formula will change and it doesn’t mean there are not many other components that could add up to cultural cool. Just saying, I think the basic strategy with the full bleed black background and a single bright color (100% M) is working here. The growing circles also do a good job of making the point that streaming music will not pay the bills and neither will selling downloads on napster or other similar sorts of sites.
The most surprising fact for me was that self-pressing a CD and selling it directly to consumers was more rapidly profitable than any of these other options. New respect for all the folks in New York and LA who have stopped me and tried to get me to buy their music while I’m walking down the street/beach.
What needs work
My biggest issue with this graphic is the the little pie charts are really where it’s at – they are not part of the big picture story that the more ‘advanced’ online music sales techniques are the less profitable per unit of effort they are for the artists. The little pie charts try to show us how the money is allotted. But the revenue pie is never a full pie and it’s difficult to tell where the money that doesn’t go to the artists or labels is going. Some clearly goes into things like the cost of the physical CD (where there is a physical CD) and some goes to the other players involved, right? But how much? And who are these other players? And why choose a pie graph technique if the pie is never completed and the incomplete part is not fully specified? In the end, what those pie charts do is compare revenue streams to two recipients – labels and artists – while offering a general sense of the amount of money going elsewhere (though we don’t know where that elsewhere is). Maybe a flowchart of dollars moving from consumers into different pots would have done a better job of demonstrating that portion of the story.
I would also point out, from a sociological perspective now, that minimum wage is both a logical reference point and a difficult reference point. Minimum wage puts a single person just over the poverty line but the poverty line is incredibly low. Poverty lines are tied to the cost of food rather than to some composite cost of daily living that includes not only food but rent, transportation/energy, health care, and all of those things that people have to spend money on which have increased more rapidly than the cost of food. It’s my long-winded way of saying that even if artists could make minimum wage they would not actually be able to live comfortably, especially not in cities like LA and NYC where there are large, vibrant music scenes. They would have an easier time in Nashville.
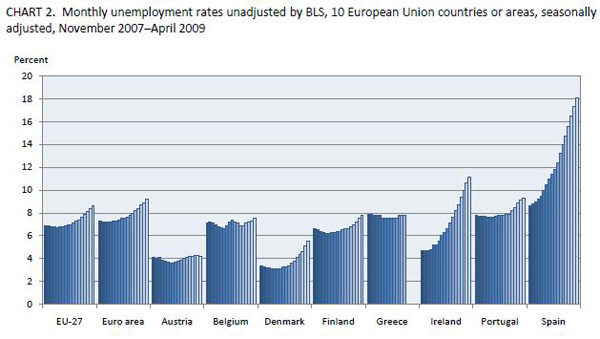
EU unemployment rates Nov. 2007 through April 2009
What works
I was looking around for a nice EU-contextualized graph showing Spain’s unemployment rate. I found what you see above which shows unemployment rates in other EU countries. That was one of my requirements – in the EU economics are sort of local and then again not so local so it’s silly to try to look at one country without taking into account the others nearby. What we see, and what has continued since this graphs last data point in 2008 is that Spain has a notably high unemployment rate. News earlier this week put the current unemployment rate here (yes, I’m in Spain) at 19.7%.
Personal anecdotes with no scientific validity whatsoever
When I’m out on the street, I would say this appears to be true – everyday is like a holiday! Well, not really. There are no parades or obvious drunkenness. But there are all sorts of young, able-bodied folks walking around, having a caña, getting on with life. People’s demeanors and attitudes do not, on their surface, suggest depression, destitution, or downtroddenness. Furthermore, I had the brazenness to open my American mouth and ask a Spaniard man I barely know what he thinks of Spain’s economic situation. He said that the unemployment rate is not at all reflective of the actual unemployment rate because everyone is working under the table. That sort of reality, if it is true, would not be reflected in graphs like the ones above and below. If people are working under the table, I can’t imagine they have full time positions just judging by how many young capable-looking people are on the street on weekdays.
What needs work
I don’t know about you, but I don’t like the gradient on the graphs. Seems superfluous. I would have lost the grey background and just gone with some rather straightforward area blocks (no lines between each bar in the graph). In simplifying that portion of the visual, I think there would have been space for more contextual data. I’m no economist, so I looked around to see what economists think of as smart ways to contextualize unemployment rates.
I found this (which has a Spanish focus):
Spain | Unemployment rate, GDP, and household savings rate
What works
The story here is that – oh yes – we can see that unemployment rate bouncing right up. But we also see that Spaniards are saving more. This has been attributed to the expectation by Spaniards that they are going to be taking in their out-of-work sons, daughters, and assorted other relatives during this crisis. We would be shocked to have such a high savings rate in America.
What needs work
I am still trying to figure out what is going on in Spain. At least as I perceive the general attitude, Spaniards appear to be prepared to weather this little ripple in the amazing growth of their prosperity over the last 60+ years by either working under the table (maybe) or leaning on family. Is an 18% savings rate meaningful in the context of a nearly 20% unemployment rate? Will this crisis simply introduce more inequality – those with stable jobs will go unscathed while those without steady unemployment sink lower than family are able to stoop to help them out? And if my man on the street is any kind of correct and the unmeasured economy is booming, how do we measure it?
If you happen to have some expertise on any of these questions, please post to the comments.
In the words of the creator of this graphic, the point here is that “there is no pattern”. The YouGov pollsters seemed to be a little more accurate, but then, as was also pointed out by the graphic’s creator, they only had one year to give it a go. Low N on that group, but maybe we can call them ‘one to watch’.
There is always a tendency in science – bench science, social science, any kind of science – to show positive results. It sort of sounds like: “Look! I found something!” Or, more likely, “After controlling for everything I could think of, including maternal grandmother’s underwear size, I have found a statistically significant correlation in the predicted direction.” But there is almost no support for saying, more or less, “I was looking for something but I found nothing.” In this particular case, a non-finding is of interest because it suggests action. We can stop paying attention to prediction polls (or chance it and continue to pay attention to YouGov, with a grain of salt). What works best here is the rigorous reporting of no pattern. Multiple polling companies, multiple elections, still no pattern.
What needs work
Seriously needs a key. Red and blue are always political colors, yellow not necessarily so, and the meanings of each cannot be assumed.
Love the title ‘poll dancing’ but wish it would mention ‘UK’ and ‘elections’ somewhere. We can deduce from the listing of the Guardian as a source that it probably has something to do with the UK, but information is global now, and we cannot assume national origins anymore. I often make this mistake myself, easy to forget to mention the nation-state. The good news is that our audiences are no longer only our neighbors. Or at least that’s how I like to think of it.
References
Suggestion from
Momin, a young fellow who contacted me by email suggested I post this one.
Alcohol Statistics, England | from The Missing Graph
What works
Leading up to the World Cup I am going to try to focus on World Cup related issues. It isn’t that much of a stretch to think about the relationship between sport and the larger category recreation, which often includes drinking. I found this graphic at The Missing Graph by Antiforma Design. The point here was to look at drinking in England – when is it happening? who is doing it? and who is dying? As you can see, men drink more and die more from drinking. Most drinking happens on the weekend and on holidays (there are more Monday and Friday holidays than other weekday holidays in England). Most alarming is that drinking deaths are increasing, not decreasing. Hard to blame it on the recession since the collection period ended in 2008 and increased the most rapidly from 2005 to 2006, a period of relative prosperity and optimism.
What needs work
I would have loved to see a couple more points of information about drinking in England. First, I assume that the information that generated the size of the bottles for each drinking day was somehow related to gallons consumed. I want to know those gallon figures per capita. Then we would be able to compare England’s data to some other country’s data, assuming we ever had a similar set of information about some other country (like, say, South Africa).
I would also have liked some information on what it is that these folks are drinking. Wine? Whiskey? Beer? Absinthe? Something from the bathtub? Perhaps the drinking culture of the country supports more beer drinking but the death-drinkers are drinking something else. Or maybe they just drink too much of the standard fare. Again, since I’m thinking about cross-national comparisons, I’m interested in things that might contribute to a deadly or less deadly drinking culture.
One other consideration: a friend of mine has long been interested in the relationship between drinking and HIV transmission. You’d think someone would have done extensive research on this because it’s rather obvious – drunk folks may have less in the way of cognition and patience when it comes to reaching for a condom. But it has not been well explored. Out of that existing curiousity of mine, I wouldn’t have minded seeing some trend lines for HIV transmission, serious auto accidents, and other sorts of ill-planned behavior that we might associate with drunkenness.
Overall, I love the notion that there is a blog out there dedicated to making infographics out of an intrinsic interest in presenting information for public consumption.
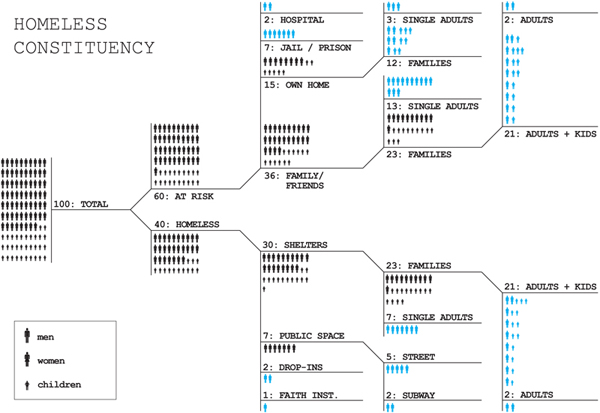
What Terri Chiao and Deborah Grossberg Katz from Columbia University’s GSAPP design school have done is come up with a way to represent percentages using a flow-chart. Not only is it creative in the sense that this sort of data rarely gets displayed this way, but it helps turn the data into a narrative. In order to figure it out, the viewer quite literally has to reconstruct a story that sounded something like this in my head: “The population they are concerned about has 40% of people already experiencing homelessness with another 60% at risk of homelessness. The folks who are already homeless are the only ones living on the street, but really, 75% of already homeless people live in shelters. As for the at-risk-of-homelessness people, 60% live with family or friends. Twenty-five percent of the at-risk population owns their homes … why, then, are they at risk of homelessness? Both the at-risk and already homeless groups have far more families than single folks. And what does it mean to be homeless in jail/prison? That you aren’t sure where you will go when you exit? Somehow I feel like that could describe a lot of the prison population. And what about half-way houses? Those still exist, right?”
The flow-chart concept is not typically used to describe the breakdown of percentages and what works here is that it forces the viewer to walk through the narrative. As a pedagogical maneuver, it’s quite successful. Because of the way the information is presented, it invites questions in a way that a pie chart or a bar graph may not. It’s also a little harder to interpret. Graphics that invite questions often are a bit more challenging to ingest, not quite so perfectly sealed as other more common strategies might appear.
What needs work
I spent a good deal of time looking at this chart trying to figure out what the blue means. I still don’t understand what the blue means.
I also would like to see on the graphic some explanation of how they determined who was at risk of being homeless. Because when I got to the section of the flow-chart that showed how many of the at-risk population owned their homes, I began to get confused. By ‘own home’ do they not mean actually owning the home, but renting it or paying a mortgage on it? And if they do mean that folks actually own their homes outright, how can they be at risk of homelessness? Is the home about to be seized by eminent domain to make way for Atlantic Yards? At risk of being condemned (I hope NYC doesn’t have so many properties at risk of condemnation)? I’m sure if the makers of the graphic ever find their way to this page they will be upset because ‘at-riskness’ is described in the paper. But in life online, stuffing a little more text into the graphic is often a good idea because cheap folks like me will take the graphic out of context and whatever isn’t included will be lost. In this case, though, all is not lost. First, you can visit the blog on which I found this lovely graphic and get the whole story. But if you aren’t ready for all that, note that the authors define those who are at risk of homelessness as anyone who has spent some time in a shelter in the past year, regardless of whether they happened to have been homeless at the time of the survey.
Bonus Graphic
They also included the graphic below. I still don’t know what the blue means. This graphic does make it easier to understand that being truly homeless appears to mean running out of friends and family who have homes to share. Because none of the truly homeless live with family and friends. It’s also clear from both graphics that most homeless people are not visibly homeless. The folks you might see sleeping on the train or the street 1) may not be homeless, they could be sleeping away from home for reasons unrelated to homelessness per se and 2) if they are homeless, they may be quite different from the rest of the homeless population. They’re more likely to be single adults than families and more likely to be men than women.
Analyzing the visual presentation of social data. Each post, Laura Norén takes a chart, table, interactive graphic or other display of sociologically relevant data and evaluates the success of the graphic. Read more…