
Course Guide for
ASIAN AMERICANS AND PACIFIC ISLANDERS
(last updated 04/2013)
Developed by Calvin N. Ho
University of California, Los Angeles
Social Construction of Race and Ethnicity
- Overview of the Social Construction of Race
- Whites, Blacks, and Apes in the Great Chain of Being
- Race, Ethnicity, and McDonald’s Marketing Strategies
- Editorial Cartoons in the Black Press During World War II
- Race and Censuses from Around the World
- Why Be Counted? And How?
Doing race and ethnicity
- Why Do the Japanese Draw Themselves as White?
- Race, Gender, and Likes on OkCupid
- Re-Racializing the Fortune Cookie
- How to Make a Chinese or Japanese Book Cover
- Ann Ducille on “Ethnic” Barbies
- Suomibhangra – The Good Brownface?
Racial mixing and multiraciality
- The New U.S. Racial Ideology
- Interracial Marriage on the Rise
- Race/Ethnicity, Assimilation, and Asian American Marriages
- Race, Response, and Dating Websites
- Interracial Marriage & the Meaning of Multiraciality
Colonialism, Neocolonialism, and Exotification
- Orientalism and the Consumption of the Other
- Colonial Circus: The Case of “Giraffe-Necked Women”
- Race, Subjectivity, and the Centrality of Whiteness
- Travel, Privilege, and the Crush of the Tourist Gaze
- Human Zoos at the Turn of the 20th Century
- “Development” Initiatives and the (In)Visibility of Power
- Colonialism, Soap, and the Cleansing Metaphor
Geopolitics
- Cartooning the US Chinese Exclusion Act
- Life in World War II Japanese American Internment Camps
- More World War II Anti-Japanese Propaganda
- Comedy that Kills Us: Demonizing Arabs and Muslims in the U.S.
- The Tsunami in Japan and the Minds of Americans
- China as a Strategic Political Threat
Racism, Discrimination, and Stereotypes
- Asian Stereotypes T-Shirts
- Racist Caricatures in Vintage Valentine’s Cards
- Why and How People of Color are Included in Advertising
- Jeremy Lin, ESPN Says, has a “Chink in the Armor”
- Responses to UCLA Student’s Racist Rant
- Ethnocentrism and Family Values
- Resistance to Racist Halloween Costumes
- Stereotype Promise
- Distracted by “Linsanity:” Hidden Racism and the Model Minority Stereotype
Gender and Sexuality
- How to Avoid Harassing Asian American Women
- The Dancing Hawaiian Girl, At Your Service
- Google Imaging the Continents
- Selling Feminine Passivity in a Cathay Pacific Ad
- Classy Asian Ladies Dating Site
- Race and the Problems with Measuring Beauty “Objectively”
- “Asian Rhinoplasty”
Statistics on Asian Americans and Pacific Islanders
- If Congress Looked Like Us
- 2010 Census Data on Racial/Ethnic Populations
- U.S. Racial/Ethnic Demographics: 1960, Today, and 2050
- U.S. Birth Rate Drops to Lowest on Record
- How Race Changes the Relationship Between Religion and Politics
- Race/Ethnicity and Voter Turnout
Geography of Asian Americans and Pacific Islanders
- Racial/Ethnic Shifts in Metro Areas
- Maps of Racial/Ethnic Populations in U.S. Cities
- Interactive Maps of U.S. Racial/Ethnic Distributions
- Interactive Map of Immigrant Settlement Patterns in U.S.
- 2010 Census Data on Residential Segregation
- Maps of Surnames
- Database of Human Development Information
- Modern Language Association’s Interactive Website
Labor Market Segmentation and Socioeconomic Mobility
- Gender, Race/Ethnicity, and the Pay Gap
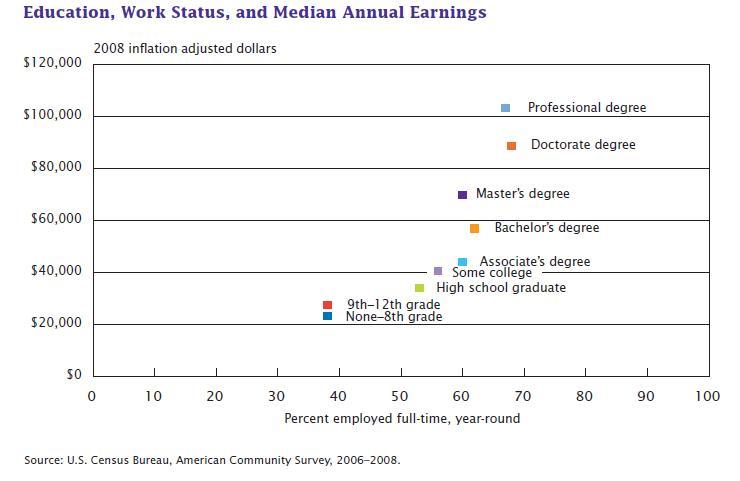
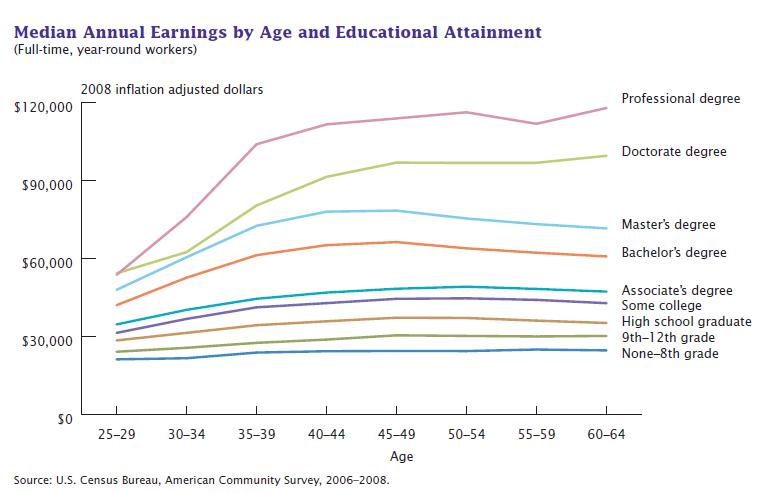
- Why Variance Matters: Race, Education, and Income
- The Growing Racial Wealth Gap
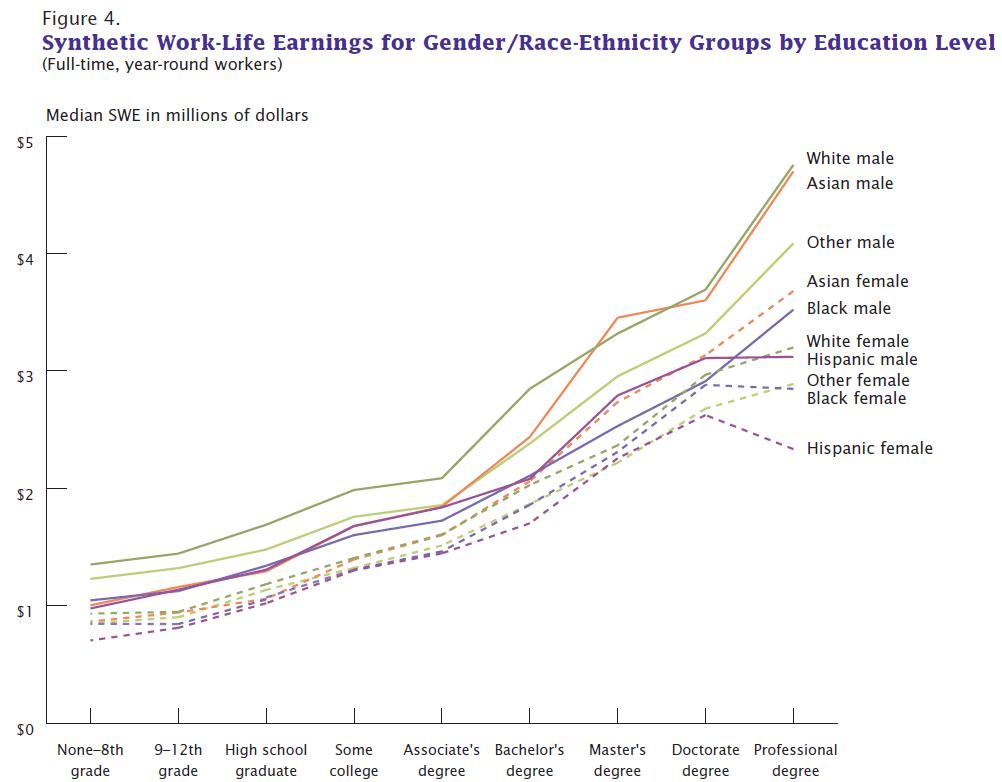
- Lifetime Earnings Gaps, by Sex and Race/Ethnicity
- Post-High-School Pathways of Men of Color
- Asian Americans and Unemployment
- Ethnic Enclaves, Linguistic Segregation, and Asian Unemployment
- New CEOs: The Diversification of the Corner Office
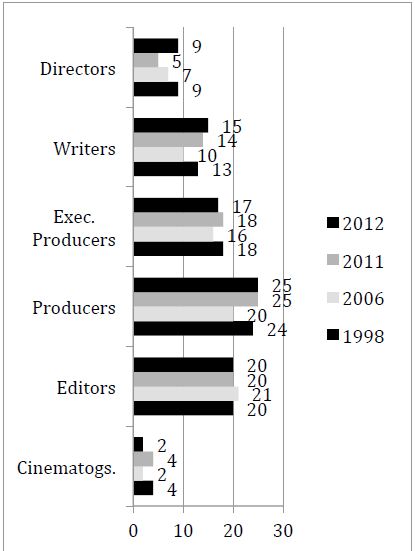
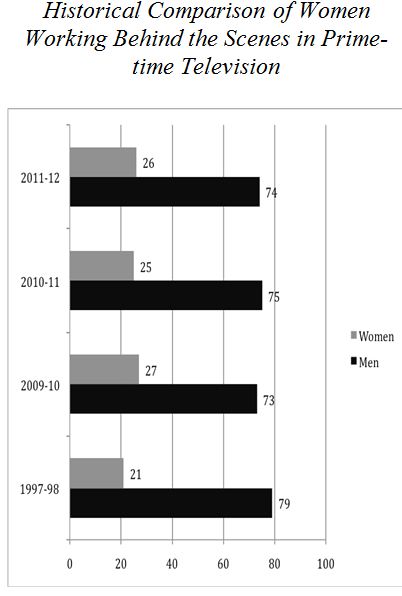
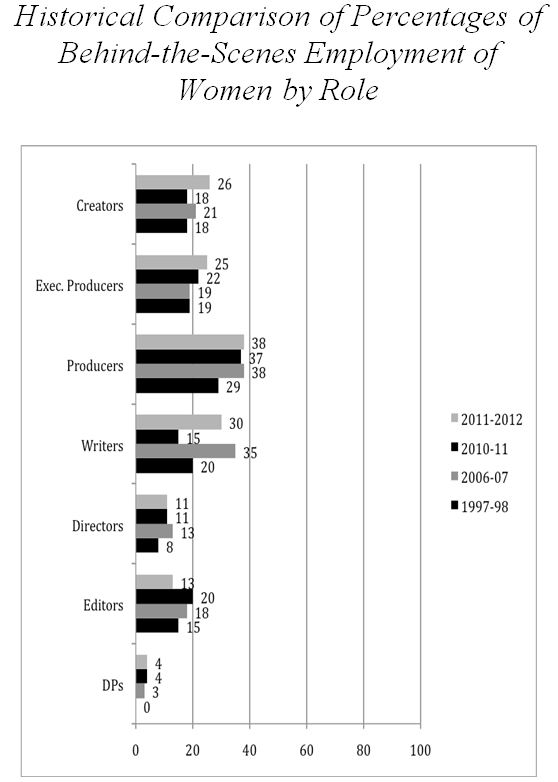
- Race, Sex, and Casting Hollywood Films


