mobility

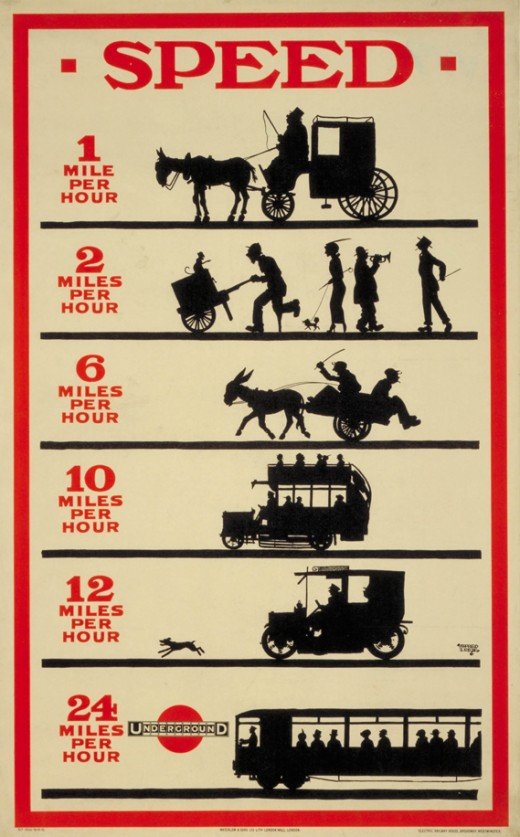
London Underground Ad 1915

What works

The London Underground has a lengthy history of using infographic thinking in their advertisements (see these ads and more on retronaut.co). What works here is that some of these ads, especially the first one, could still be used with positive impact today if the silhouettes were updated to include the transit types actually on the street out there. If I saw an infographic that compared the speed of walking (with and without a stroller), taking the subway, taking a cab, and biking to incite me to take the subway or bike, I would find that compelling. I’d imagine many New Yorkers would agree with me. Probably so would Londoners. It is remarkable how long lasting this ad is.

What needs work

The ad needs to have a better implementation of the scale associations in the miles per hour that would help communicate the idea that the underground is faster than all the other modes of mobility. If someone were to make this infographic today, they would probably make the slower forms of mobility look shorter (almost like applying a bar graph where the slower mobility forms haven’t made it as far across the page). They probably would also scale the size of the number representing kilometers per hour. Maybe they would become more and more italicized, leaning farther and farther to the right to indicate speed. Maybe they just would have gotten bigger as they approached the fastest speed.

Moving on in time, I think the next ads for the London Underground are actually not as strong as this first one, at least until we get to 1969. We see below a graphic that is supposed to help Londoners understand what their Underground fares are actually funding, but there is no scale comparison available from one ‘bar’ in the bar graph to the next. What’s more, the numbers associated with the bars are represented by the coinage. The viewer has to do the math by himself or herself. Personally, I find that to be a kind of naive approach to representing the fare distribution, one that has the viewer doing mental work to add up coinage, which is kind of incidental to the question, rather than comparing one category of expenditures to the others, which is the heart of the question that was posed.
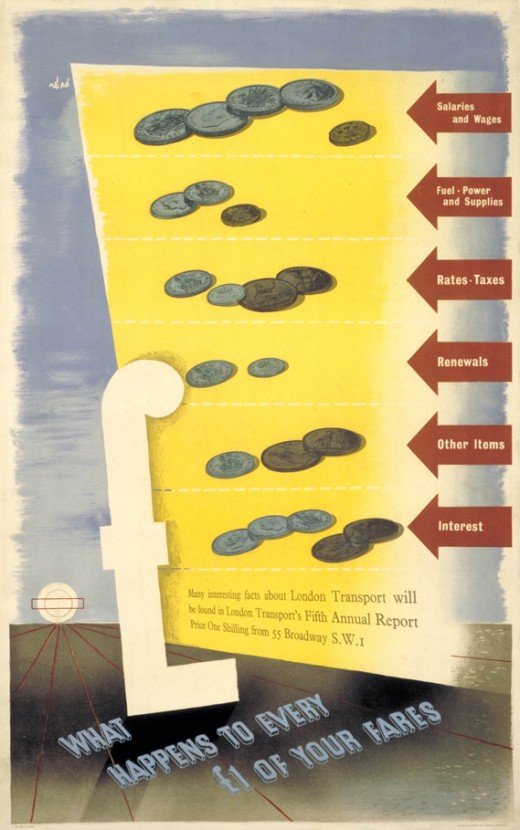
London Underground Ad 1938

The Individual Group, Pop Art, and London Underground ad improvements

This ad is much better, more compelling, it still carries the idea of infographic representation from the fare split into coinage by representing people not as dots but by keeping them as actual people (or passenger cars). The photo of a street full of cars that stretch so far we can’t see the end of it steps to a photo of just the human bodies carried by those cars and finally all those humans on a single bus. This particular instantiation of that idea is much stronger. In my opinion, I imagine the advertisers here having been influenced by the artistic work of the UK’s Individual Group who were the British version of American Pop Artists.
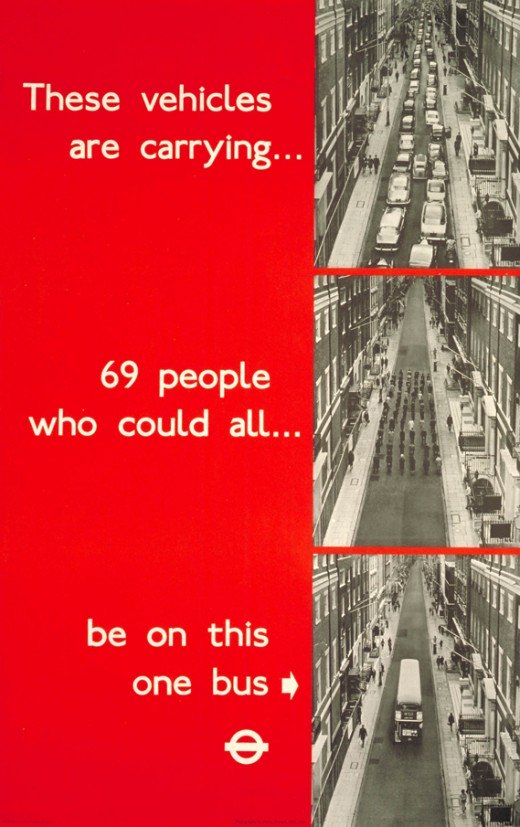
London Underground Ad 1969

Artistic comparison

Just for fun, compare the ad above with some work by American Feminist Artist Barbara Kruger (for you non-art history people, feminist art followed pop art and used a lot of performance work but also maintained some of the pop art movement’s interest in the tropes of advertising, collage techniques, and the use of text in art. See also later conceptual artist Jenny Holzer.)

Barbara Kruger "Your gaze hits the side of my face" 1982
Barbara Kruger "Your Manias Become Science" 1981
Barbara Kruger "Untitled" 1981

References

Retronaut.co (4 January 2012) London Transport Infographics, 1912-1969 [blog post].

Kruger, Barbara. (1981) Untitled. [collage] Accessed online at http://www.eng.fju.edu.tw/Literary_Criticism/feminism/kruger/kruger.htm

Kruger, Barbara. (1981) Untitled. [collage] Accessed online at http://www.eng.fju.edu.tw/Literary_Criticism/feminism/kruger/kruger.htm

Kruger, Barbara. (1982) “Your gaze hits the side of my face” [collage] Accessed online at New York University’s Fales Collection at Bobst Library http://www.nyu.edu/library/bobst/research/fales/exhibits/downtown/soho/sohoart/documents/kruger.html.

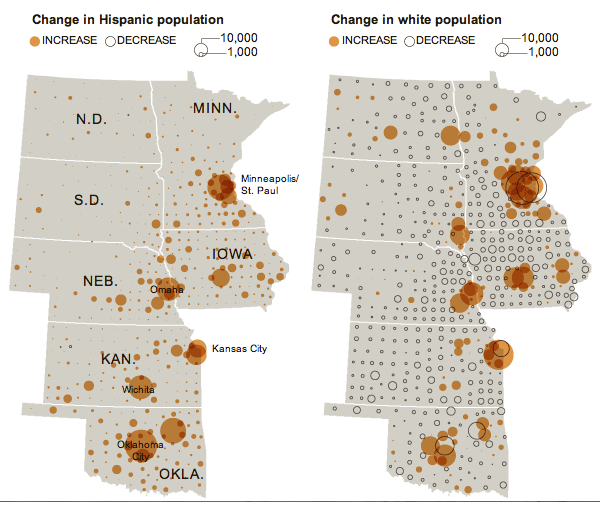
Increase and decrease in Hispanic population in the Dakotas, Minnesota, Iowa, Nebraska, Kansas, and Oklahoma | 2010 Census

What works

This is a quiet story, the kind of thing that may or may not be picked up by a major national newspaper like the New York Times. Rural America is often used as a political flag to wave by politicians, but there is not often too much coverage of day-to-day life. The 2010 Census clearly shows,

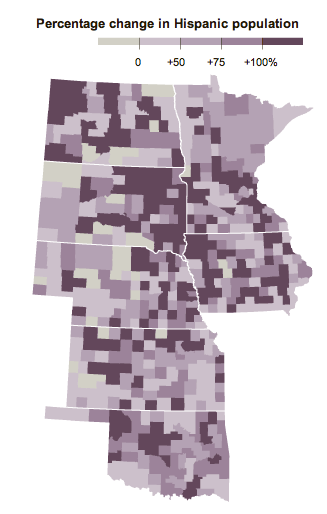
The Hispanic population in the seven Great Plains states shown below has increased 75 percent, while the overall population has increased just 7 percent.

What is equally odd is that this story is running two graphics – the set of maps above and the one below – that more or less depict the same thing. I salivate over things like this because it gives me a chance to compare two different graphical interpretations of the same dataset.

The two maps above includes a depiction of the change in the white population as a piece of contextual information to help explain where populations are growing or shrinking overall. These two maps show that 1) in many cases, cities/towns that have experienced a growth in their hispanic populations also received increases in their white populations (hence, there was overall population growth) but that 2) there are some smaller areas that are experiencing growth in the Hispanic populations and declines in the white populations.

The second map shows only the growth in the Hispanic population without providing context about which cities are also experiencing growth in the white population. Looking at the purple map below, it’s hard to tell where cities are growing overall and where they are only seeing increases in the Hispanic population which is a fairly important piece of information.

Percent change in hispanic population in the Dakotas, Minnesota, Iowa, Nebraska, Kansas, Oklahoma

What needs work

For the side-by-side maps, the empty and colored circles work well in the rural areas but get confusing in the metropolitan areas. For instance, look at Minneapolis/St. Paul. Are the two central city counties – Hennepin and Ramsey – losing white populations to the suburbs? That is kind of what it looks like but the graphic is not clear enough to show that level of detail. But at least the two orange maps allow me to ask this question. The purple map is too general to even open up that line of critical analysis.

This next point is not a critique of the graphics, but a direction for new research. The graphics suggest, and the accompanying article affirms, that Hispanic newcomers are more likely to move into rural areas than are white people. Why is that? Is it easier to create a sense of community in a smaller area, something that newcomers to the area appreciate? If that is part of the reason new people might choose smaller communities over larger ones, for how many years can we expect the newcomers to stay in rural America? Will they start to move into metro areas over time for the same reason that their white colleagues do?

Are there any other minority groups moving into (or staying in) rural America? Here I am thinking about American black populations in southern states like Alabama, Mississippi, and Arkansas. Are those groups more likely to stay in rural places than their white neighbors? For that matter, what about white populations living in rural Appalachia. Are they staying put or are they moving into cities like Memphis, Nashville, and Lexington?

How do things like educational attainment and income levels work their way into the geographies of urban migration?

References

Queens College Department of Sociology. (13 November 2011) Changing Face of the Rural Plains [information map graphics] Queens College: New York.

Sulzberger, A.G. (13 November 2011) Hispanics Reviving Faded Towns on the Plains New York Times: New York.

Hidden-city airfares in the US

Excellent use of a map

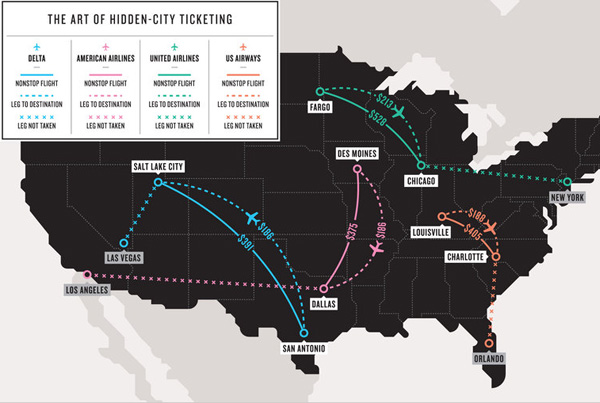
I spend a lot of time explaining which uses of maps are bad. In this case, the use of a map is spot-on. Nothing could better display this information than a map. So here’s what you are seeing. Due to the mechanism that determines flight pricing, some non-stop flights from City A to City B are cheaper than multi-leg flights that take passengers from City A to City C with a layover in City B. Figuring out where these curiously expensive cities are and then booking tickets through them (instead of to them) is called hidden-city ticketing. It’s technically forbidden by the airlines because it messes up their profit-making abilities, more on that later.

There are some markets – Atlanta, Cleveland, Salt Lake City, Charlotte, Detroit, Cincinnati or Chicago O’Hare – where prices are too high compared to the rest of the airfare market. If you want the longer version of why this is true, there is an excellent, lengthy, FiveThirtyEight/Nate Silver blog post, Which Airports Have the Most Unfair Fares?, on the vagaries of airfare pricing. Suffice it to say, if you happen to need to fly into one of these expensive cities, especially if you do it often, you are interested in figuring out how to avoid feeling like you are getting ripped off.

As a visual representation of this simple-but-hard-to-explain Point A to Point C via Point B scenario, a map is the best way to clarify the concept. Just look at how the visual works. A person starts in Fargo and wants to get to Chicago. If they crank that request through kayak, they end up with a direct flight to Chicago for $586 [ouch]. But if, instead, they tell kayak that they want to go from Fargo to New York with a layover in Chicago they end up paying only $213. Kayak let’s you tell it where you’d like to have a layover. (Detroit’s airport is surprisingly nice, for instance, and if I have to layover in the summer, I’ll go through Detroit.)

How can airlines charge less to fly a person a greater distance? Not all airline pricing is driven by fuel, snacks, and human capital costs. A good bit of it is driven by demand and supply – the classic economics story from your undergrad days. Some markets are not well served creating mini-monopolies for service in and out of those airports. Other markets, like New York, have a great deal of service provision forcing airlines to pull their prices into a lower, more competitive range.

Is it legal?

Perhaps you have read somewhere in your ticket’s fine print that the airline prohibits you from bailing out of your scheduled travel halfway through the trip. The New York Times asked a lawyer whether or not it’s even legal for the airlines to penalize people this way and how far they can go to punish someone caught doing this. It turns out, there are penalties the airlines can impose, but most of them can be side-stepped by savvy travelers. The Times presented recommendations, summarized here:

Making a habit of this certainly won’t endear you to the airlines. Most of them — the major exception being free-spirited Southwest Airlines — expressly forbid it in their ticketing rules. But those rules don’t carry the force of law, and most travel lawyers say that their recourse is limited. They could probably preclude you from flying with them in the future, but their case for demanding penalties is weak, and the risk of detection is low if you don’t book these kinds of routes more often than a couple of times per carrier per year.

Also, do not end up checking bags. They will end up at your final destination. Get to the gate early enough to ensure yourself space in the overhead bins.

Book your itinerary as two one-way flights. This should be logically obvious. If you are going from Fargo to Chicago but you book your ticket through to New York, you clearly won’t be wanting a return flight from New York because you never intended to actually see the Big Apple in the first place. The other kicker is that if you fail to report for part of your ticket, the airline will probably cancel whatever remains on the ticket. So book one-ways.

Don’t lie if the airlines catch you; lying increases your likelihood of being found guilty of fraud. Honesty is the best policy.

References

Silver, Nate. (6 April 2011) Which Airports Have the Most Unfair Fares? [blog post] The New York Times, FiveThirtyEight blog.

Silver, Nate. (4 May 2011) How to beat high airfares. Sunday Times Magazine. [Graphic The Art of Hidden-City Ticketing]

Percentage of US citizens holding passports, by state
Percentage of US citizens holding passports, by state | Andrew Sullivan

Passport background

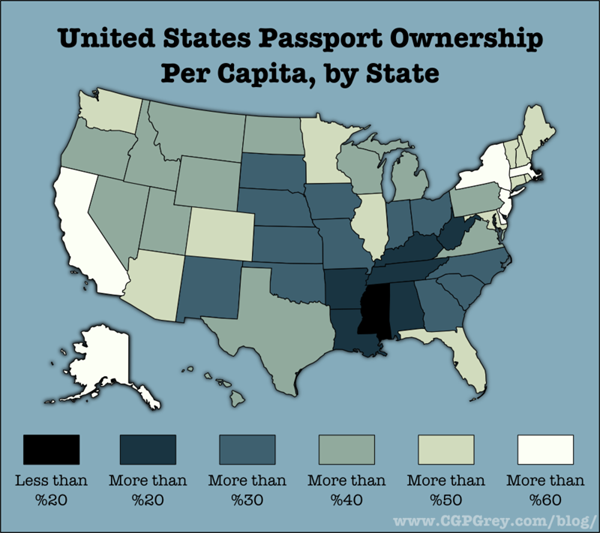
In 2008 as part of the war against terror, US citizens were required to have a passport to travel to countries like Canada and Mexico that had previously allowed passport-free travel. US citizens could drive or walk into Canada and Mexico with a driver’s license and be allowed to drive or walk right back in. In 2011, we see from this map that even now, not all US citizens have passports, not even close. Getting a passport is time consuming, costly, and generally requires some evidence that the person applying for the passport intends to travel outside the US. That last requirement is kind of a no-brainer, why would anyone want to go through the effort to obtain a passport if they never planned to leave the US?

What works

Always skeptical about mapping data that could appear in a table or chart, I have decided that I’m neutral on this particular use of mapping as a presentation device. If the map had included Canada and Mexico rather than just making the US appear to float in space, I would probably have been more convinced that the map was the way to proceed with this information. If I had created a chart or a table, I would have divided the US states into two groups: those that border foreign countries and those that do not. Have a glance at the map again and you will see that the states bordering foreign countries have higher percentages of passport holders, on average, than those states that do not border foreign countries. Florida and Illinois do not border foreign countries and yet they both have high percentages of passport holders. In the Florida case, I would say it’s almost as if Florida borders foreign countries since so many of its near neighbors are island nations – Haiti, the British Virgin Islands, the Dominican Republic, and so forth.

Illinois is home to Chicago, a destination for immigrants and immigrants often leave family in other countries whom they would like to visit. Thus, they will need passports. The same is true for most big cities – New York and California (home to New York City and Los Angeles) also have large immigrant populations and large numbers of passport holders. On the other hand, Saskia Sassen might point out that what’s going on in Chicago, LA, and New York is that all of these cities are global cities, hubs of activity in Finance, Insurance and Real Estate (FIRE industries). These FIRE industries are global industries and require their workers to travel internationally at higher rates than the same kinds of workers in other industries.

It would be interesting to compare the rates of passport holders to both the rates of first generation immigrants and the proportion of workers in the FIRE industries in all these states.

What needs work

As I mentioned, presenting this information as a map begs to have Canada and Mexico included. In order to visualize the story here, it would be helpful to see what is happening at the borders, to remind ourselves that the US does not simply float in space. It is geographically specific and it matters that some states have international borders and others do not. Sometimes these borders ARE the story and I think when we’re talking about passport holders, the borders are important.

If this information were to be presented as a set of bar graphs, we would risk some information overload since there would be 50 bars. But that might be alright if it became instantly visually clear that the border states have higher rates of passport holdership than the interior and non-bordering states. Plus, with a bar graph, the numbers could have been layered on each bar (and really, they could have been layered on each state in the map) so that we would be able to get a more precise calculation. Simply knowing that we are working with some number in a 10% range is kind of sloppy for my tastes. That’s just me. And sometimes with information like this it’s silly to try to get granular because the data collection method could have a fairly wide margin of error. Though I should hope that the feds know who is holding passports. I suppose people could apply for them in one state and then move to another state. The feds may not know about moves following passport application and that could introduce some fuzziness.

Note: I tried to go to the original source of the map several times but the page timed out repeatedly. Therefore, I ended up citing Andrew Sullivan at the Atlantic since that is where I encountered the map and it is a website that I believe you can visit whereas cgpgrey.com/blog is not visit-able. If I had been able to visit I might have been able to figure out where the passport data came from in the first place – presumably some federal department.

References

Sullivan, Andrew. (8 March 2011) Map of the Day: How many Americans have a passport, by state in The Daily Dish at The Atlantic online. [Graphic by cgpgrey.com/blog]

Sassen, Saskia. (2001 [1991]) The Global City: New York, London, Tokyo, 2nd ed. Princeton, New Jersey: Princeton University Press.

Regroup, Ex-Google workers at their next jobs | R. Justin Stewart
2am 2pm, Minneapolis Transit on a Sunday | R. Justin Stewart

Art and infographics intersect

Artist R. Justin Stewart has taken infographics into the third dimension. His work is more art than information but it’s clear that it builds on the visual tropes of information graphics.

The first image depicts the way that ex-Google workers dispersed into new jobs after their time at Google. The point is not that any of us happen to care deeply about Google workers – someone does but probably not the readers of this blog – but to see how Stewart depicts network graphs in actual space.

The second two images depict a transit system in Minneapolis over a twelve hour period on a Sunday morning. It’s elegant but far too abstract to ‘work’ as an infographic. This is not a critique – I do not think Stewart wanted to make literal art – but it does not take much creativity to see that it would be easy to layer more information onto the artistry of the presentation.

My major contribution to this discussion and the reason that I decided to post Stewart’s work is that much of the art that has been inspired by the data revolution has happened in digital space. We have seen some amazing pixel-based animations and visualizations on this very blog. But I have not come across too much work in three dimensions, real space, that shares so many conventions with information graphics or data-based ways of knowing. A million points tell a story. Usually they tell that story in the same digital realm in which they were born, but Stewart takes them offline into actual spaces. They get installed. He has to come up with the way he wants to represent intangible information with tangible physical components.

Immigration to the US | Absolute Numbers
Immigration to the US | Absolute Numbers, courtesy of Thomas Brown and IBM's Many Eyes Tool


Immigration to the US 1900 - 2000 | Relative flows from sending countries
Immigration to the US 1900 - 2000 | Relative flows from sending countries, courtesy of Thomas Brown and IBM's Many Eyes Tool

What Works

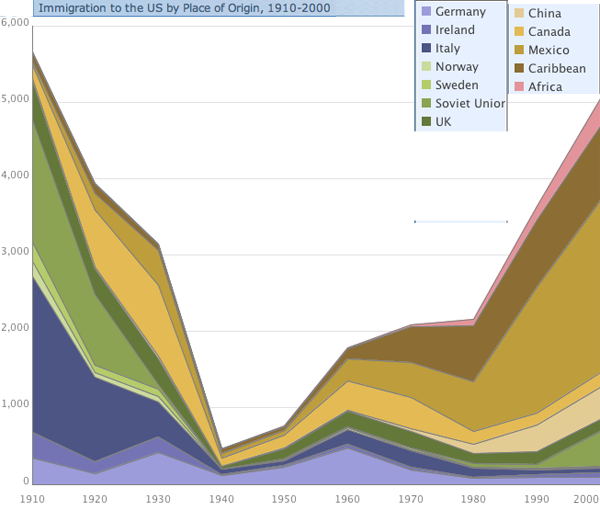
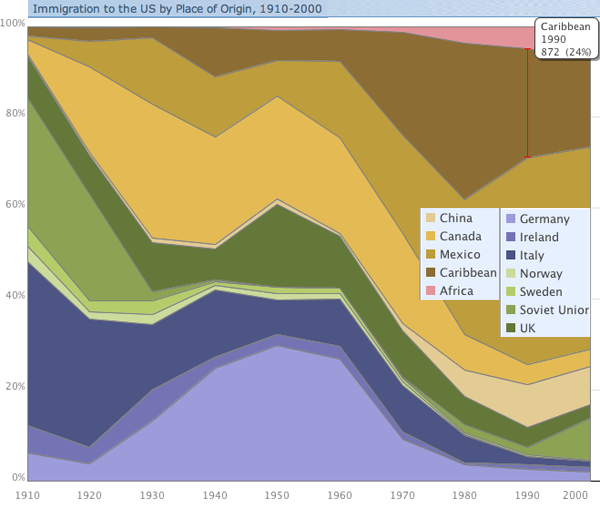
Before you read any further, ask yourself which one of these graphs is most useful. Which one has the most information? If you had to get rid of one of them but still be able to explain the basic flows of people into the US over the last century, which one would you keep? And would your story be much weaker, somewhat weaker, pretty much the same after the loss of one of the graphs?

First, I was moaning the other day about a graphic – like the one I posted recently about prescriptions for treating mental illness in the US – in which color is used to make it look like there is important information being encoded when, in fact, the colors are just pretty, nothing more. I am happy to report that in this case, the colors are not only useful, but necessary. Try to imagine looking at this thing in gray scale. It would be nearly impossible to read. So kudos for color in general. In specific, I probably would have tried to group the countries that are near each other in the world within a color family. Sweden and Norway are good examples of what I would have done throughout – they are both green, just different shades. That makes good logical sense. On the other hand, Ireland and the UK are not in the same color family and it confuses me. I also don’t see great geographic or other similarities between Canada/Mexico and China. So I would have kept the Canada and Mexico as they are and found a different color for China.

Now I’m going to get back to the question I asked at the beginning of the post: could you do without one of these graphics if you had to axe one? It’s a leading question and the answer is clearly: yes. The first one is far better than the second one. Looking at absolute flows by country of origin gives a much more interesting and fully articulated picture than looking at the relative values of people coming at any one point in time.

What Needs Work

The numbers behind this graph were pulled from Census Data, a good place to go because they are the most reliable numbers we are likely to find (at least with respect to legal immigration – undocumented immigration is, well, undocumented so the Census doesn’t help). However, the thing about Census Data is that it’s going to show us flows for a decade at a time and I wonder if it might be a little misleading to show these numbers as an augmented line graph. A bar graph might be better and here’s why: smoothing the lines implies decade reliant time trends that don’t exist. Unfortunately, in the real world, important decisions do not always take place in the same year the census is taken. The Immigration Reform Act of 1965 was right between decades. Now I know you’re thinking something along the lines, ‘anyone who studies immigration is going to know when that reform act was and when WWI, WWII, the Depression, and all sorts of other important historical events took place. we’re not idiots.’. I agree; you are not idiots.

On the other hand, if I were to create this as a bar graph, I would have the freedom to actually locate the legislation as a graphic element – a line flying a flag announcing the name of the act, for instance – right between the bars for 1960 and 1970. But of course, that would make it difficult to see how the flows are changing over time, so I might superimpose a kind of shadow version of the current line graph over (or under) the bars so that the eye can be aided in its path from one bar to the next. Line graphs do show change much better. But I like the idea of being explicit with the time periods in which the measurements occur and with the notion of leaving graphical space to add important contextual details.

This graphic was created by Thomas Brown using IBM’s free Many Eyes visualization tool. I wholeheartedly support IBM and the other companies and organizations that are making powerful visualization tools available for free. In case you aren’t familiar with them, they allow users to input data and then they take that data and produce visual representations of it. In this case, the full version of the graph is interactive – hovering the mouse will reveal greater detail about any given flow at a point in time. This is a great thing. I support layering of information. The layering available at Many Eyes does not quite make up for the inability to layer in the way that I described above, but I’m not disappointed with IBM. There are already tools for manipulating graphics. The best way to use IBM’s tool is not to expect it to do everything, but to take their visualizations and then further enhance them in photoshop or your favorite image editing software.

Also Note

This graphic is about spaces but it is not a map. For whatever reason, people use maps whenever there is mention of geography, and even sometimes when there isn’t, even though the map is often not adding to the story and making it harder to immediately grok what the important patterns are. Just because geography or mobility might be part of the story you are trying to tell, it isn’t necessary to use a map to encode your narrative visually.

References

Thomas F. Brown. Immigrant Origins via email on 11 October 2010.

IBM’s Many Eyes data visualization tool.

US Census Historical Statistics for Immigration by Number and Rate and Immigration by Leading Country or Region of Last Residence.

tokyo-map-metro
Tokyo Metro Map (click to embiggen)

Away message

Maps of public transportation are my favorite visual shorthand for any major city, not only because I have to rely on mass transit where ever I go, but also because these highly stylized versions of cities contain much more than the bare minimum amount of information to get from one point to the next. I will be in Tokyo checking out the public transit system and attending the 4S conference through the end of the month.

See you back here in September.

Manhattan traffic patterns
Manhattan traffic patterns | Wired Magazine June 2010

What works

The tendency with geographical data is to try to find a way to portray everything on a map. Surely, there is a map up there, and many people will recognize that the area is Manhattan instantly by looking at the map before they read it in the title. That’s a nice thing about maps – they transcend language and bad captioning to some degree. However, much of the detail is not to be found in the map. The map just shows us where congestion tends to occur, but it doesn’t tell us when we can expect these areas to be congested or just what “congested” means. In Manhattan, the average speed is under 10 mph so does congested mean less than 5 mph? Or what?

But if we look at the other graphs and charts it is a veritable jackpot of traffic information, at least at the collective level. I wouldn’t try to use this collection of information to plan your route through the city unless, of course, this collection of information causes you to take the subway instead of driving.

I hate pie graphs (as in the “Proportion of Miles Traveled”), but I am sympathetic to the triangulated pie graphs in the “Vehicle Distribution” graphic. At least it is visually easier to calculate the volume of a true triangle than a rounded off triangle. So if you find that you have to go with a pie graph, emulate the triangulated version found here and your viewers will come away with a better understanding of the information you are attempting to convey. I was surprised at how many people take taxis to get to work. But I am even more surprised at how many fewer trips there are on weekends. Fewer than half of those made on an average weekday.

Anecdotal evidence warning: When I first moved to Manhattan, I remember sitting in the car for two hours to drive around the block. There was a street fair nearby (not on any of the sides of the block traversed in this trip) and that seemed to slow everything to a standstill.

What needs work

I would have found a way to combine the average speed and the delays and associated costs. Clearly, the two are related – lower average speed must mean more delays. I had a little trouble understanding the delays and associated costs without the text from the article. If the speed and costs had been integrated into a single graphic instead of split into two (with a big pie graph in between), I think the link between speed, delays, and costs would have started to become more intuitive.

Here’s an excerpt from that section for the curious:

“In the end, Komanoff found that every car entering the CBD causes an average of 3.23 person-hours of delays. Multiply that by $39.53–a weighted average of vehicles’ time value within and outside the CBD–and it turns out that the average weekday vehicle journey costs other New Yorkers $128 in lost time.”

For more on how that was calculated, you’ll have to read the article. But the bottom line came down to a proposed $16 toll to enter Manhattan below 60th Street. It’s about what drivers in central London pay and the proceeds would go to bolster public transportation. Such an idea – known as congestion pricing – was proposed by the Bloomberg administration but voted down in 2008.

References

Salmon, Felix. (June 2010) “The Traffic Cop.” in Wired Magazine [infographic by Pitch Interactive].

Bonanos, Christopher. (17 December 2007) “Fare Enough” New York Magazine.

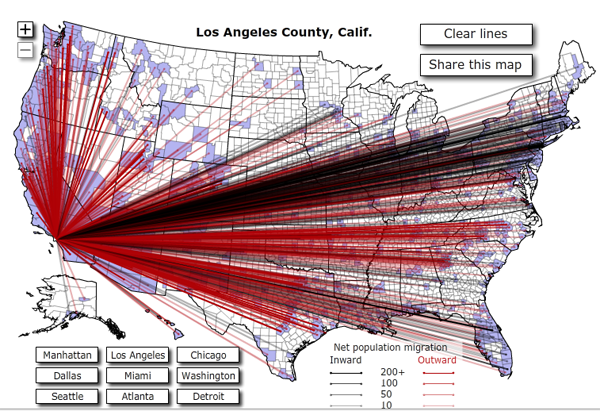
Migration into and out of Los Angeles, CA (2008)

What works

This is an interactive graphic situation so to get the most out of it, I recommend clicking through to forbes.com and playing around.

What works is that we can see a lot of internal migration between Los Angeles and other west coast cities as well as between LA, Florida, and the DC-NYC-Boston corridor. I know plenty of bi-coastal folks so the picture matches up with my experience. To get the proper context, I suggest you click through and pick some rural counties to see how much people tend to move from small place to small place and from big place to big place but not so much from very small to very big or vice versa.

Overall, what the interactive graphic ends up showing us is that people move quite a bit. The map gets saturated with lines.

Man, we can really make some cool graphics – and interactive ones at that – with the ridiculous capacity of desktop computers these days. This is a data-driven graphic that would have been nearly impossible not that long ago.

What needs work

There is no comparison for this graphic. I can’t tell if all this migration is more than normal, trending up, trending down, or anything of that nature. Sheer volume at one time can generate lots of questions but it doesn’t answer many.

I’d also be curious to know if the movers are evenly spread across the life course. Plenty of people move to go to college and then again when they leave college, or so I think. And there has been plenty of ink spilled about retirees moving south from places like Chicago and Minneapolis. Then, about ten years ago, I remember reading stories about the plight of the managerial class having to move around within their multi-national corporations to keep progressing in their companies all through their mid-life. With all those half-baked hypotheses, I would love to see how life stage impacts internal migration.

References

Bruner, Joseph. (15 June 2010) Map: Where Americans Are Moving at forbes.com.

Shipping by Barge
Shipping by Barge | Lock and Dam #1, Mississippi River at St. Paul/Minneapolis

What works

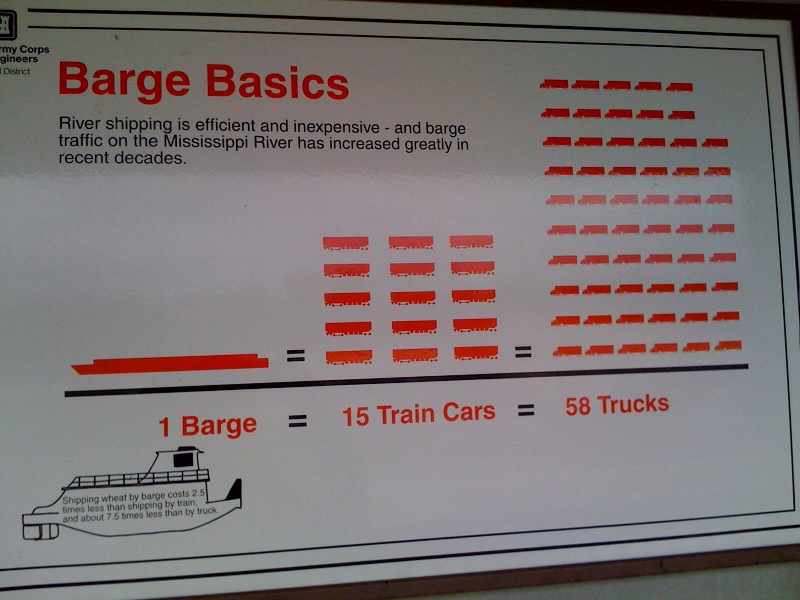
Amidst all that discussion of environmental sustainability and local food movements, I haven’t heard anyone even whisper a mention of barge shipping. Waterways used to be some of the best shipping lanes (sometimes some of the only shipping lanes) available. Now there isn’t much traffic of that sort at all. This graphic implies that it might be in the best interest of economical and environmental efficiency to reconsider barge shipping. It certainly got my cognitive wheels whirring.

Style points for the reduced color pallet. In my book, lots of things could be black, white, and red* all over.

*where red can be switched out for just about any color at all

What needs work

First, I apologize for the quality of the photograph. Cell phone cameras, big posters, and narrow walkways make for crappy pictures. At least it was a cloudy day and there wasn’t so much glare.

This graphic was clearly created a long time ago – I’m guessing it has been hanging in the same place for a couple decades. Still one would think that since the 1970’s, at least some people in the US have cared about fuel efficiency. This graphic only displays an odd kind of size efficiency which is incredibly difficult to understand the more you think about it. Sometimes size matters. In this case, size as measured by number of hauling units (which themselves are different sizes) is nearly irrelevant.
In my opinion, it would be better to describe efficiencies in terms of the amount of fuel required for their example trip of a bunch of wheat. Measuring fuel burned would not only allow us to be able to compare between the modes, it would also allow us to understand the cost per pound of wheat (or whatever) in terms of transport alone, which could be of interest to all the local food folks. Does living on the Mississippi make all upstream food “local” in a way that overland food isn’t, at least if it is shipped by barges?

The next step after adding some kind of measure of fuel efficiency would be to spell out the kinds of emissions that are involved with each mode of transit per pound of item delivered.

I’m also curious about what kinds of commodities can be shipped efficiently by barge – is it only commodity level items like grains, coal, corn, taconite? Or would it make financial and environmental sense to load barges up with products like cars and consumer goods? And what happens to the materials when they come off the barge? Are they mostly shipped to areas where the manufacturing takes place near the river port? Minneapolis used to be a city in which grain mills lined the banks of the Mississippi and a barge full of flour could just be brought directly from the barge into the flour mill, no trucks or trains got involved. But what about other products? Not all cities are located on navigable rivers so once goods come off the barges are they usually placed on trains, on trucks, or what?

In short, this graphic implies that barges are more efficient or more economical than train or truck shipping modes but it fails to provide enough context to support that claim or to indicate which kinds of shippable goods are best for barge shipping.

References

Photograph by Laura Norén, June 2010. Feel free to borrow it, morph it, post it elsewhere, etc.