
What works
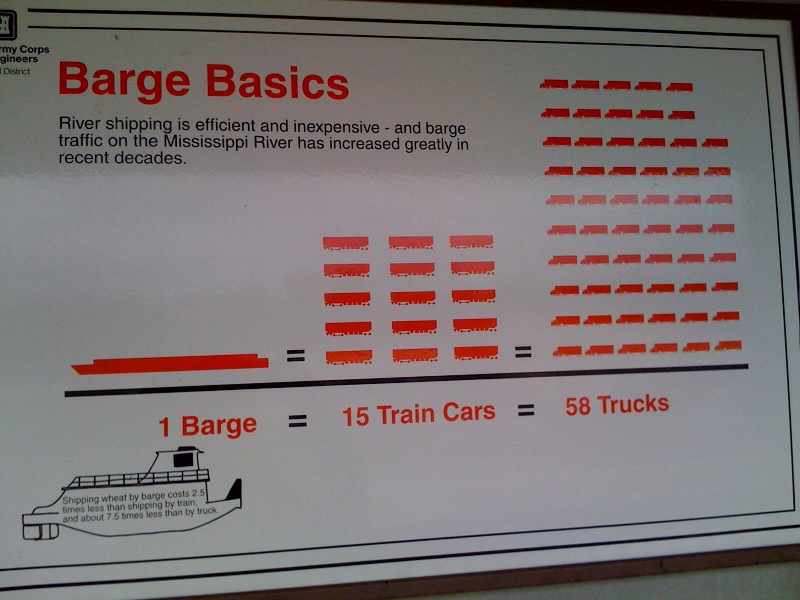
Amidst all that discussion of environmental sustainability and local food movements, I haven’t heard anyone even whisper a mention of barge shipping. Waterways used to be some of the best shipping lanes (sometimes some of the only shipping lanes) available. Now there isn’t much traffic of that sort at all. This graphic implies that it might be in the best interest of economical and environmental efficiency to reconsider barge shipping. It certainly got my cognitive wheels whirring.
Style points for the reduced color pallet. In my book, lots of things could be black, white, and red* all over.
*where red can be switched out for just about any color at all
What needs work
First, I apologize for the quality of the photograph. Cell phone cameras, big posters, and narrow walkways make for crappy pictures. At least it was a cloudy day and there wasn’t so much glare.
This graphic was clearly created a long time ago – I’m guessing it has been hanging in the same place for a couple decades. Still one would think that since the 1970’s, at least some people in the US have cared about fuel efficiency. This graphic only displays an odd kind of size efficiency which is incredibly difficult to understand the more you think about it. Sometimes size matters. In this case, size as measured by number of hauling units (which themselves are different sizes) is nearly irrelevant.
In my opinion, it would be better to describe efficiencies in terms of the amount of fuel required for their example trip of a bunch of wheat. Measuring fuel burned would not only allow us to be able to compare between the modes, it would also allow us to understand the cost per pound of wheat (or whatever) in terms of transport alone, which could be of interest to all the local food folks. Does living on the Mississippi make all upstream food “local” in a way that overland food isn’t, at least if it is shipped by barges?
The next step after adding some kind of measure of fuel efficiency would be to spell out the kinds of emissions that are involved with each mode of transit per pound of item delivered.
I’m also curious about what kinds of commodities can be shipped efficiently by barge – is it only commodity level items like grains, coal, corn, taconite? Or would it make financial and environmental sense to load barges up with products like cars and consumer goods? And what happens to the materials when they come off the barge? Are they mostly shipped to areas where the manufacturing takes place near the river port? Minneapolis used to be a city in which grain mills lined the banks of the Mississippi and a barge full of flour could just be brought directly from the barge into the flour mill, no trucks or trains got involved. But what about other products? Not all cities are located on navigable rivers so once goods come off the barges are they usually placed on trains, on trucks, or what?
In short, this graphic implies that barges are more efficient or more economical than train or truck shipping modes but it fails to provide enough context to support that claim or to indicate which kinds of shippable goods are best for barge shipping.
References
Photograph by Laura Norén, June 2010. Feel free to borrow it, morph it, post it elsewhere, etc.