The key
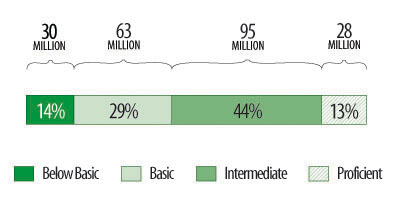
Number of Adults in Each Prose Literacy Level
Prose Literacy
* Below Basic:
o no more than the most simple and concrete literacy skills
* Basic:
o can perform simple and everyday literacy activities
* Intermediate:
o can perform moderately challenging literacy activities
* Proficient:
o can perform complex and challenging literacy activities
What works
This is a simple way to do a bar graph when all of your bars will add up to 100%. Just think: they could have laid this information out in a standard bar graph with a separate bar for each level of literacy. This way, it’s easier to see that all these parts add up to a whole population.
It is alarming that there are more people ‘below basic’ than ‘proficient’ especially in the increasingly text-based world we live in. Emails and chat clients have replaced many phone calls which is especially critical for workers. (I wonder if on a per-communication basis it costs more to use the phone. Anyone seen data?)
What needs work
I would have tried to get the categories labeled within the graphic itself. Referring to a bulleted list is a bit cumbersome. On the other hand, I appreciate the desire to thoroughly describe what each categorical label actually means, and it would have been hard to elegantly place all those words into the graphic.
References
National Assessment of Adult Literacy. (2003) Demographics overall.

Comments 1
Donuts are the new pie charts? » Graphic Sociology — December 16, 2009
[...] I think donut charts are even harder. I would prefer that the donut get stretched out like in the literacy in the US graphic from last week. It’s easier to compare the length of a line segment than the length of a [...]