
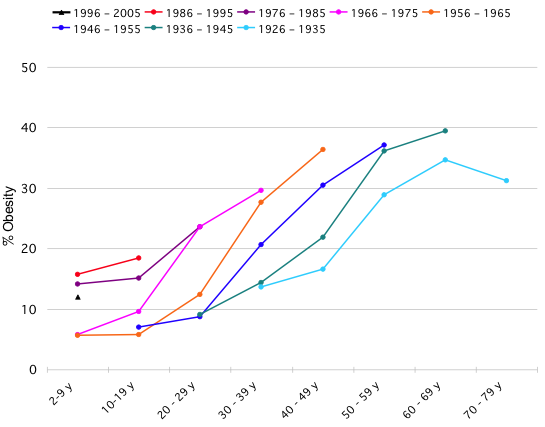
The graph below was originally posted at Flowing Data with an invitation for readers to take the same information and display it with clarity and meaning. The image below is difficult to understand – it brings to mind one of my favorite tricks which is to see if the infographic would deliver more or less the same message if it were in gray scale. This one would suffer in gray scale even more than it already is, a bad sign.
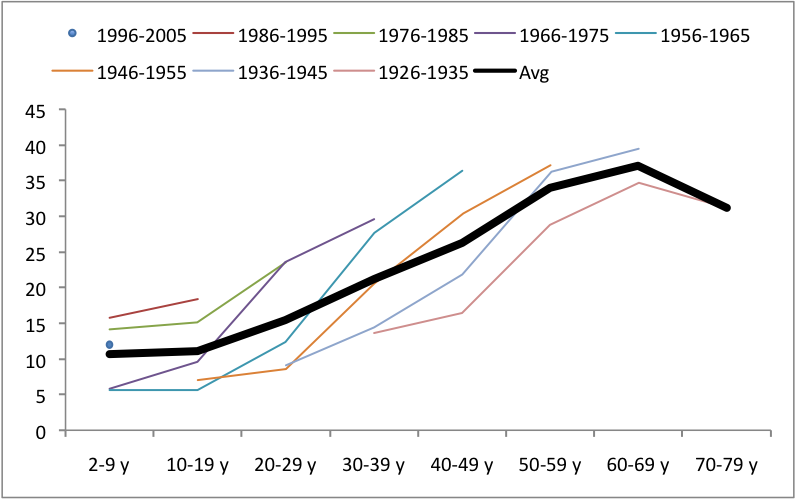
Jonas Sekamane took up the challenge posed by Flowing Data and came up with what you see below as a first stab. He said, “My main “beef” with the graph above, is that comparison is difficult, if not impossible. This is of course due to the data gaps, but it could easily be fix with a guideline of some sort. Adding an age-group average, makes it much easier for the viewer to see if the level of obesity is in fact high or low.”
But he didn’t rest on his relatively simple fix. He decided that starting over altogether would be the only way to wrestle this information into a clear, meaningful infographic. First, he massaged the data into a more visually relevant format by calculating, “an index in Excel where 100 = the age-group average.”
I agree with his assessment of the original – that it was too far gone to be saved. I’d also like to take this opportunity to address social scientists more accustomed to the writing process than to graphic design process. Just as a paper will require several drafts before it reaches it’s potential, most graphics get better with revision. And like this reworking proves, sometimes it is necessary to scrap it all and start over, even after you think you have something could work. The key is that you cannot fall in love with your graphic designs (or your papers). In order to maximize their potential, some of them will need demolition and redesign, not just a new coat of paint.

Reference
Sekamane, Jonas. (29 April 2010) “Obesity Trends – Makeover”
Flowing Data (29 April 2010) Challenge – Graphing Obesity Trends
Comments 3
Ayurveda group — May 15, 2010
As we continue to grapple with Obesity, a question that is not getting too much attention is the role Alternative systems of medicine like Ayurveda can play in controlling / curing obesity. A system based on Nature can not be all that bad :-)
pesi e sovrappesi « dati e cifre trasformati in capolavori e orrori — June 20, 2010
[...] mio avviso la soluzione migliore è quella presentata da Graphic Sociology, che impiega la tecnica dei cosiddetti small [...]