Archive: Nov 2012

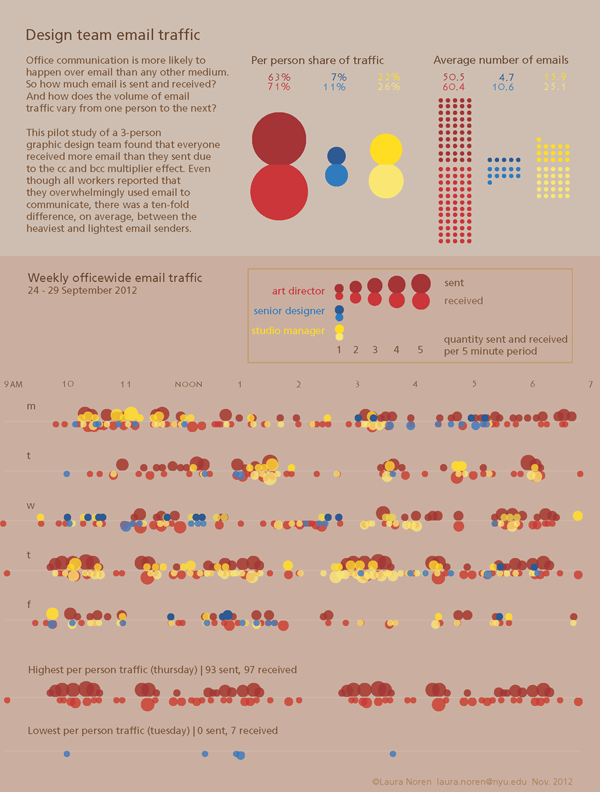
Office email traffic

Editing process in graphic design

The editing process in graphic design is somewhat different than the editing process in writing. Writers tend to start with a skeleton, make sure the bones are all in the right places, and then slowly add and sculpt musculature and skin through iterative processes. Graphic designers start with a whole bunch of skeletons, subtract a few, add musculature to the rest, subtract a few of those, add skin to the remaining ones, and then only late in the process will a single design go through a final polishing process.

One of the ways social scientists teach students to become skeptical about the things they read is by teaching them how to edit their own work and the work of others. Students start to see how pieces of written work represent a series of choices. They see that what they’ve read could have gone in other conceptual directions, used different evidence, been shortened, lengthened, stripped of jargon, or otherwise constructed and styled in new ways that could have changed the meanings taken away by the readers. Learning to construct, critique, and polish writing is a major part of how readers develop the tools they need to understand and analyze the works they read.

There is far less educational time spent teaching students how to create visual work, especially visual work outside of the realm of personal expression (I feel like most arts programs emphasize personal expression which is different than creating visual work with the intent of displaying data or even political messaging). It is not surprising that we end up with a bunch of people who struggle to apply an analytic lens to information graphics. This leads to a communications power imbalance that privileges certain kinds of visual devices, including information graphics, over writing inasmuch as information graphics are more likely to be accepted without too much scrutiny since most folks do not have a good idea where to begin to scrutinize them. Information graphics combine the moral authority of numbers with the cognitive inertia of sight that lies behind the cliche that ‘seeing is believing’.

In the service of pulling back the curtain on graphic design, I thought it might be useful to save an entire series of drafts in the development process of a graphic that describes the email traffic in a small design work group. The purpose is to break the seal around the image and reveal it is a series of decisions that might easily have been otherwise.

First Draft

First, I thought a stem and leaf diagram might work.
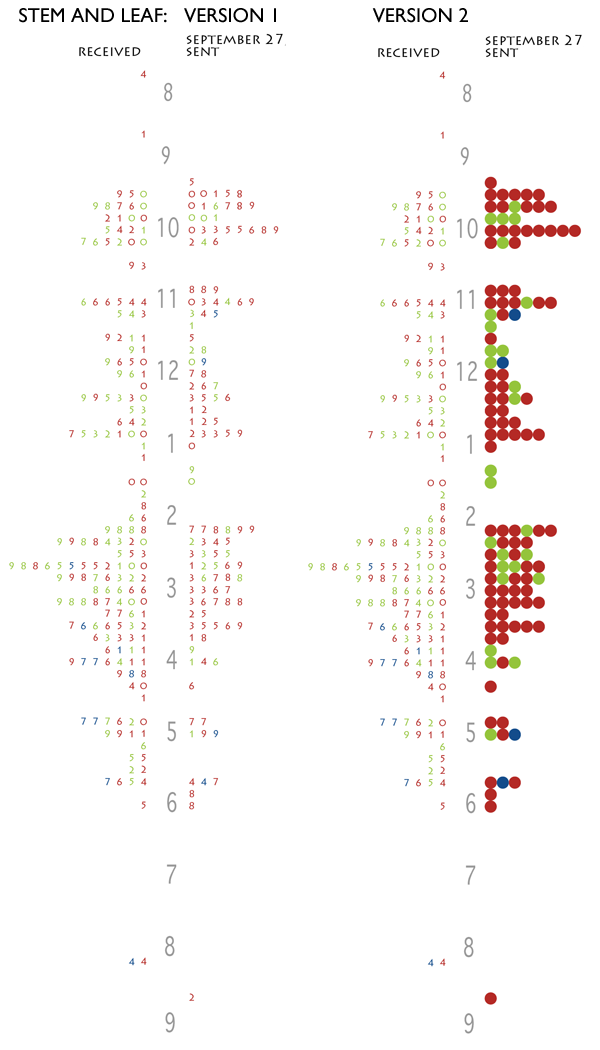
Stem and Leaf diagrams of office email traffic

But these graphics failed because there was no way to keep strings of receiving or sending visually united. If the people in the office happened to be sending (or receiving) a series of email that spanned between one ten-minute period and the next ten-minute period, that run would be visually broken. I also wasn’t thrilled with the way the sent email matched up with the received email. It was hard to see that when one person in the office sent an email, it would often land in the inbox of someone else in the office.

Still, I liked the version where I turned the numbers into balls and that idea came back in a different form later in the development process.

Second Draft

I decided to abandon the stem and leaf for a timeline. I initially imagined triangles as markers for the email because I thought the shape would indicate the directionality of an email going out into the internet.
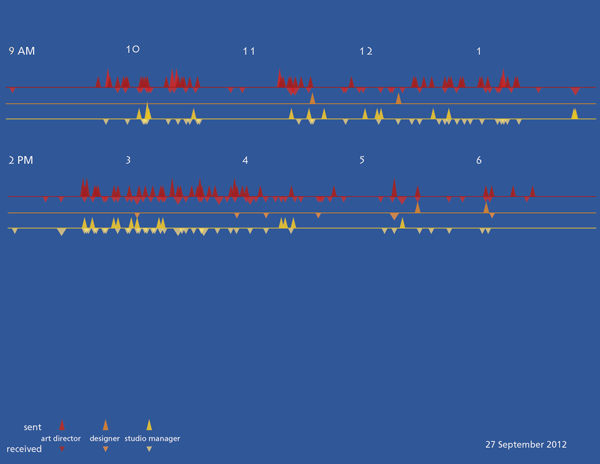
email traffic timeline, version 1
This version has an entire day on one page, morning sits above afternoon.

And I tried some different color schemes.
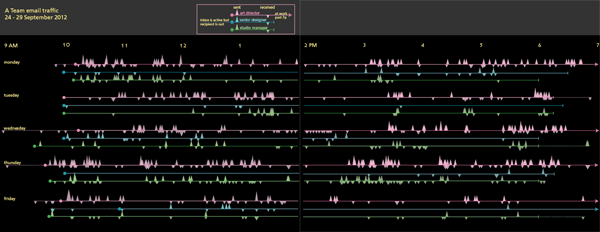
Email traffic timeline, version 1.1
Email traffic timeline, version 1.1 stretching the day across two pages.
Email traffic timeline, version 1.2

The triangles did not work and some of the color schemes created a sense of vibration. A trained graphic designer might have tried the triangles (and rejected them, of course), but they would not have made the mistakes with color that I did.

Third draft

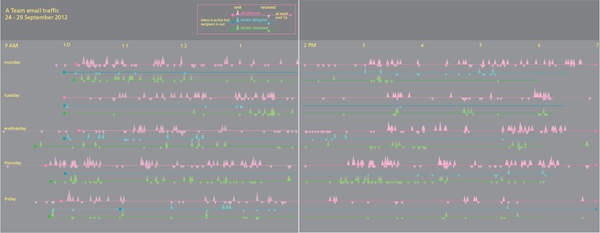
I replotted the graphic with circles, not triangles, and added up all the emails that were received in 5-minute periods instead of plotting each individually. This lost a bit of granularity, but it made it easier to see where traffic was greatest because it allowed the height of the circles start to draw the eye.
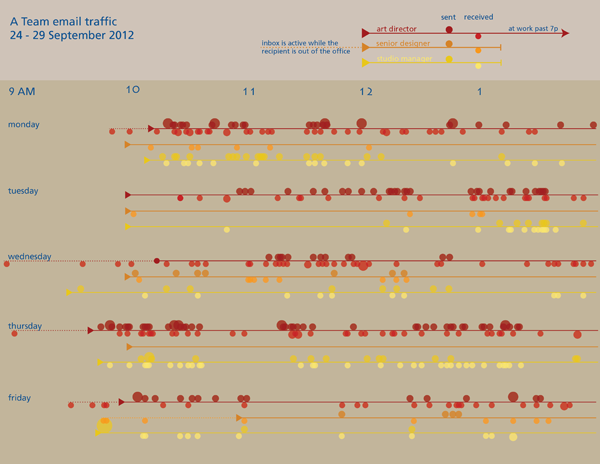
Email timeline, version 1.3
There is another page to the right of this one but viewing the image at this scale displays more detail.

This version is much closer to the final but something was missing.

Fourth draft

I started to realize that the timelines were difficult to analyze so I went back to the data and pulled out some summary statistics about the average number of emails each person sent and received. I also thought it would be interesting to see how much of the officewide traffic each person generated. While I was looking for new ways to help people understand what they were looking at, I also showed them the range of reality in the same timeline format by pulling out the lines for the highest traffic person-day and the lowest traffic person-day. I also remembered one of the lessons I learned from reading Nathan Yau’s Visualize This and added some descriptive text. [A full review of that book is here.]

Office email traffic

This is as far as I have gotten. But if I get good suggestions in the comments, I’ll keep improving.

What can writers learn from graphic designers

Getting through this many drafts alone was hard. It is very hard to see the same thing with new eyes. I got some help from two different people and even though neither of them said much, their opinions made a huge difference in the process. I encourage writers to find a way to share their work with others earlier in the process. It is humbling. If the comparison to graphic design is apt, earlier sharing either of the whole draft or of smaller sections will also likely lead to a stronger piece that gets written faster.

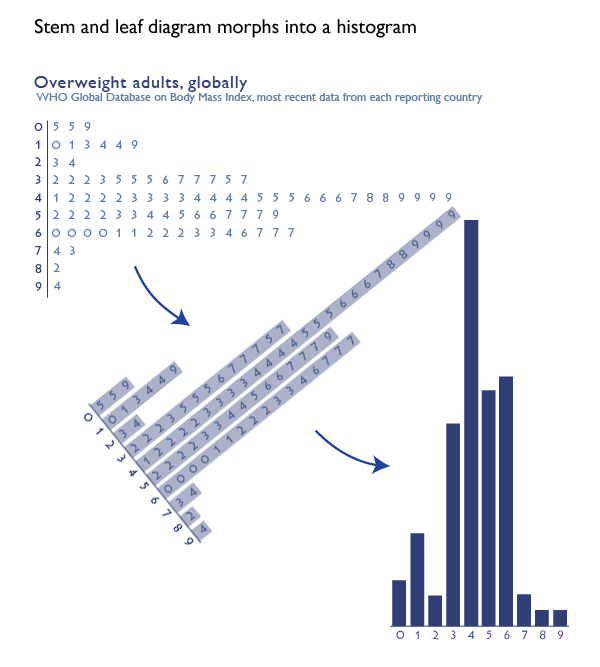
Stem and leaf diagram becomes a histogram

What works

The stem and leaf diagram is an old stand-by that has largely been abandoned in social science as it morphed into the histogram. It is a rather ingenious graphical device that could be created even with a typewriter, which is how people used to prepare documents not that long ago. And when I say ‘people’ used to prepare documents, I am actually imagining wives and girlfriends of the husbands and boyfriends who were preparing final drafts of their dissertations and later the (mostly female) secretaries, administrators, and lab assistants typing up articles and figures for (mostly male) professors. [Refer to this graphic on the gendered nature of degrees at the doctoral level for supporting evidence that it was mostly men writing dissertations and then getting the jobs available to people who had written dissertations.]

How to make a stem and leaf diagram

1. Start with numerical data. Organize it from least to greatest.

2. Think of each number as having a stem and a leaf. The stem is the more durable part of the number and the leaf is the more sensitive part of the number. For a number like 57, the more durable part of the number is the ‘5’ because even if there was some variation in the measure, the number in the 10’s spot might not change but the ‘7’ in the singles spot is more sensitive and thus more likely to flutter like a leaf. If we were measuring temperature, for instance, it would be a lot more likely that the day would have temperatures like 56 and 58 than 60-something and 40-something. Thus, the tens spot is the stem and the singles spot is the leaf in this case. It would be possible to use measurements in the hundreds or even thousands.

3. Once you have identified your stems and leaves, type the lowest stem value. Then type a bar or some other vertical device to separate your stem from your leaves. Then look at all the observations you have for that stem value. Type in every single observed leaf value for that stem, starting with the lowest one. So if you are creating a diagram of all the temperatures registered at noon for the month of November, you will have 30 values to stick in your chart. You will probably have something like three values in the 30s – say, 35, 37, and 38. This would mean you would type a 3, then a vertical bar, then 5, 7, and 8. If there were also nine values in the 40s – say 40, 41, 42, 42, 43, 45, 45, 46, and 48 you would hit carriage return. Then you’d type a 4, a vertical bar, and 0 1 2 2 3 5 5 6 8. You see how people (mostly women) could use typewriters to make graphics.

The strength of this technique is that it forces the actual dataset into a visually organized diagram. All of the values can be read right out of the graph but the device as a whole gives an impression of the overall pattern.

4. At some point after typewriters, the stem and leaf diagram morphed into a histogram. I think Excel had something to do with this, but I am still researching just how it was that the stem and leaf diagram was relegated to the dustbin while the histogram rose to take its place.

Worth thinking about

Stem and leaf diagrams are close cousins of bar charts and histograms. While bar charts and histograms might be more attractive in some ways, they are, in fact, less data-rich. It is not possible to read the actual values out of a colored bar. Despite the fact that the histogram chart form *could* be more visually pleasing than the stem and leaf diagram the fact that histograms allow more space for aesthetics means that they can just as easily be uglier, not more appealing, than stem and leaf diagrams. Dumb and ugly is no good at all. Still, bar charts gave rise to things like stacked bar charts that allow us to visualize observations for multiple investigations that share the same variables so I do not consider them a step backwards.

What about global body mass index?

The information in the graphs above comes from the World Health Organization’s database of global body mass index. The numbers represent the percentage of people in the overweight or obese range of the body mass index in individual countries, NOT the average body mass index of individual countries. Notice that one country [American Samoa] has over 90% of its adult population in the overweight or obese range. If you’re curious, the US has 66.9% of our adults in the overweight+obese range. Vietnam is on the low end with only 5% of its adults overweight or obese.

References

World Health Organization Global Database on Body-Mass Index. [Last accessed 17 November 2012]

Hot Dog Eating Contest Graph
Hot Dog Eating Contest Graph – Large version

Preface to the book review series

There are two ideal types of infographics books. One ideal type is the how-to manual, a guide that explains which tools to use and what to do with them (for more on ideal types, see Max Weber). The other ideal type is the critical analysis of information graphics as a particular type of visual communications device that relies on a shared, though often tacit, set of encoding and decoding devices. The book reviews I proposed to write for Graphic Sociology include some of each kind of book, though they lean more towards the how-to manuals simply because more of that type have come out lately. As with all ideal types, none of the books will wholly how-to or wholly critical analysis.

I meant to review two of Edward Tufte’s books first so that we would start off with a good grounding in the analytical tools that would help us figure out which parts of the how-to manuals were likely to lead to graphics that do not commit various information visualization sins. However, I have spent the past six weeks at a field site (a graphic design studio nonetheless) and it rapidly became completely impractical to lug the two oversized, hard cover Tufte books around with me. I found Nathan Yau’s paperback “Visualize This” to be much more portable so it skipped to the head of the line and will be the first review in the series.

The Tufte review is next up.

Review of Visualize This by Nathan Yau

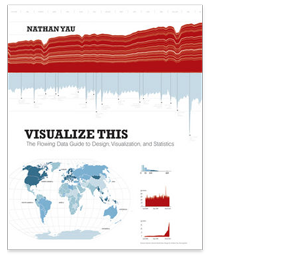
Visualize This book cover

Yau, Nathan. (2011) Visualize This: The FlowingData guide to data, visualization, and statistics Indianapolis: Wiley.

Visualize This is a how-to data visualization manual written by statistician Nathan Yau who is also the author of the popular data visualization blog flowingdata.com. The book does not repeat the blog’s greatest hits or otherwise revisit much familiar territory. Rather, this was Yau’s first attempt to offer his readers (and others) a process for building a toolkit for visualizing data. The field of data visualization is not centralized in any kind of way that I have been able to discern and Yau’s book is a great way to build fundamental skills in visualization that use tools spanning a range of fields.

The three primary tools that Yau introduces in the book are two programming languages – R and python – and the Adobe Illustrator design software. Both R and Python are free and supported by a bevy of programmers in the open source world. R is a programming package developed for statistics. Python has a much broader appeal. Both of them can produce data visualizations. Adobe Illustrator is neither free nor open source but it is worth the investment if you are planning to do just about any kind of graphic design whatsoever, including data visualizations. Yau mentions free alternatives, and there are some, but none have all of the features Illustrator has.

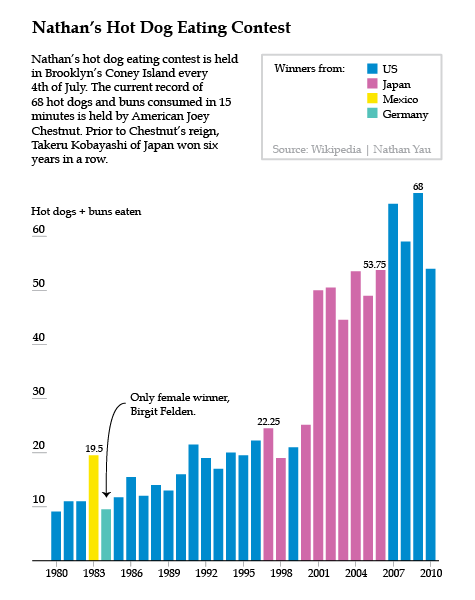
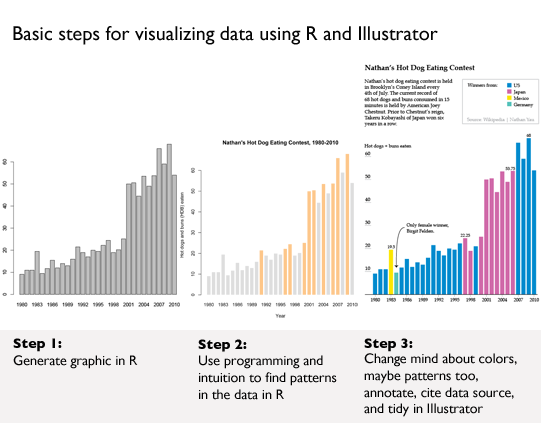
Much of the book starts readers off building the basic bones of a visualization in R or python, based on a comma-separated value data file that has already been compiled for us by Yau. He notes that getting the data structured properly often takes up more than half the time he spends on a graphic, but the book does not dwell much on the tedium of cleaning up messy data sources. Fine by me. One of the first examples in the book is a graphic built and explored in R, then tidied up and annotated in Illustrator using data from Nathan’s Hot Dog Eating contest.

This process is repeated throughout:
   1. start visualizing data with programming;
   2. try to find patterns with programming;
   3. tidy up and annotate output from program in Illustrator.

The panel below shows you what R can do with just a few lines of code. Hopefully, it also becomes clear why it is necessary to take the output from R into Illustrator before making it public.

Visualize This - example from chapter 4
Visualize This – example from chapter 4

Great tips

There are hints and tips sprinkled throughout the book covering everything from where to find the best datasets to how to convert them into something manageable to how to resize circles to get them to accurately represent scale changes. This last tip is one of my favorites. When we visualize data and use circles of varying sizes to represent the size of populations (or some other numerical value) what we are looking at is the area of the circle. When we want to represent a population that is twice as big as the size of some other population, we need to resize the circle so its area is twice as big, not its circumference.

How to scale circles for data visualization

More great tips:
1. First, love the data. Next, visualize the data.*
2. Always cite your data sources. Go ahead and give yourself some credit, too.
3. Label your axes and include a legend.
4. Annotate your graphics with a sentence or two to frame and/or bolster the narrative.

*Love the data means take an interest in the stories the data can tell, get comfortable with the relationships in the data, and clean up any goofs in the dataset.

Pastry graphics: Pie and donut charts

Yau’s advice about pie charts diverges from mine. I say: use them only when you have four or fewer wedges because human eyes really have trouble comparing the area of one wedge to another wedge, especially when they do not share a common axis. Yau acknowledges my stubborn avoidance of pie charts but advises a slightly different attitude:

Pie charts have developed a stigma for not being as accurate as bar charts or position-based visuals, so some think you should avoid them completely. It’s easier to judge length than it is to judge areas and angles. That doesn’t mean you have to completely avoid them though. You can use the pie chart without any problems just as long as you know its limitations. It’s simple. Keep your data organized, and don’t put too many wedges in one pie.

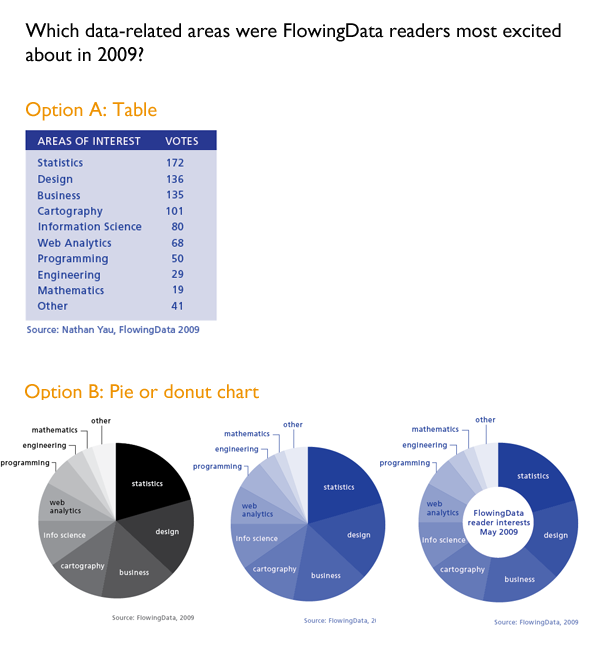
The Yau explains how to visualize the responses to a survey he distributed to his own readers at FlowingData to see what they’d say they were most interested in reading about. He showed the readers of the book a table with the blog readers’ responses which I’ve recreated below [Option A]. I think the data is easier to read in the table than in either the pie chart or the closely related donut chart [Option(s) B]. In life as in visualization, a steady stream of pies and donuts is fun but dumb. Use sparingly.

Visualize This example from chapter 5

Interactive graphics

Learning about pie charts was great fun even though I don’t like pie charts because Yau taught us how to use protovis, a javascript library that yields interactive graphics. We built a pie chart just like the one(s) in Option B that popped up values on mouseover the wedges. Protovis was developed at Stanford and has now morphed into the d3.js library. The packages developed in Protovis are still stable and usable. I highly recommend this exercise for anyone who wants to make infographics for the web. It helps to have a basic understanding of html going in.

What needs work

The overarching problem I had with Visualize This is that it spent relatively little time generating different types of graphics using the same data. We saw a little bit of that above when Yau used both a pie chart and a donut chart to visualize the same survey responses, but since donut charts are just variations on pie charts, it was not the best example in the book. The best example came when Yau visualized the age structure of the American population from 1860 – 2005 (I updated the end date to 2010 since I had access to 2010 census data).

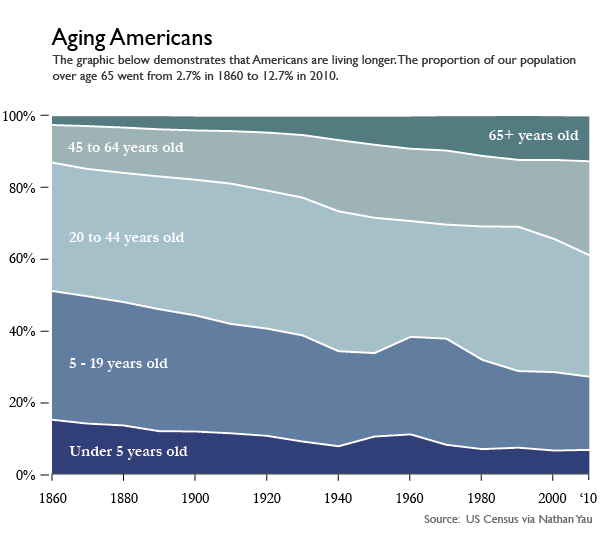
First, Yau shows readers how to make this lovely stacked area graph in Illustrator. That’s right. No R. No Python. Just Illustrator.

Aging Americans
Aging Americans | Stacked area graph version

Then Yau admits that the stacked area chart has some general limitations:

One of the drawbacks to using stacked area charts is that they become hard to read and practically useless when you have a lot of categories and data points. The chart type worked for age breakdowns because there were only five categories. Start adding more, and the layers start to look like thin strips. Likewise, if you have one category that has relatively small counts, it can easily get dwarfed by the more prominent categories.

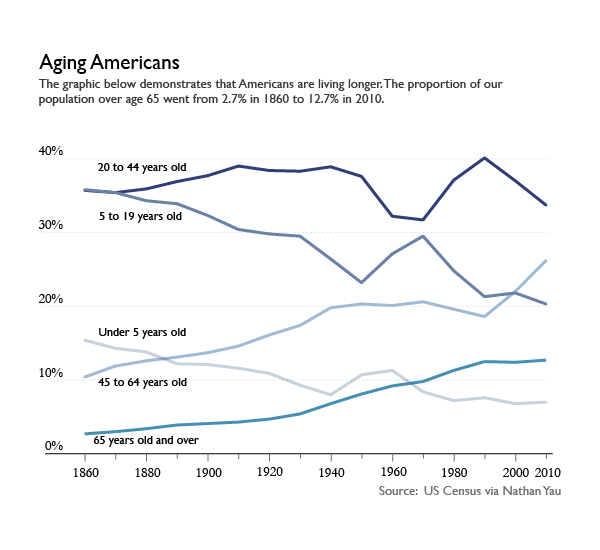
I tend to disagree that the stacked area chart ‘worked’ for displaying the age structure of the US population, but not because there were too many categories. I’ll get to why I don’t think the stacked area graph worked shortly, but first, let’s have a look at the same data represented in a line graph. This was Yau’s idea, and it was a good one. What we can see by looking at the data in a line graph rather than a stacked graph is the size ordering of these age slices. Yeah, I can kind of see that the 20-44 group was the biggest group in the stacked graph. But I had to think about it. In the line graph, I don’t wonder for a second which group was biggest. The 20-44 group is on top. The axes in line graphs just make more sense. I admit that the line graph is not an aesthetic marvel the way the area graph was. But, you know, you can figure out your own priorities. If you want pretty, go with the area graph and get smart about colors (with the wrong color scheme, any graphic can look awful. See also: what Excel generates automatically). If you want a graphic for thinking with, avoid stacked area graphs.

Aging Americans
Aging Americans | Line graph version

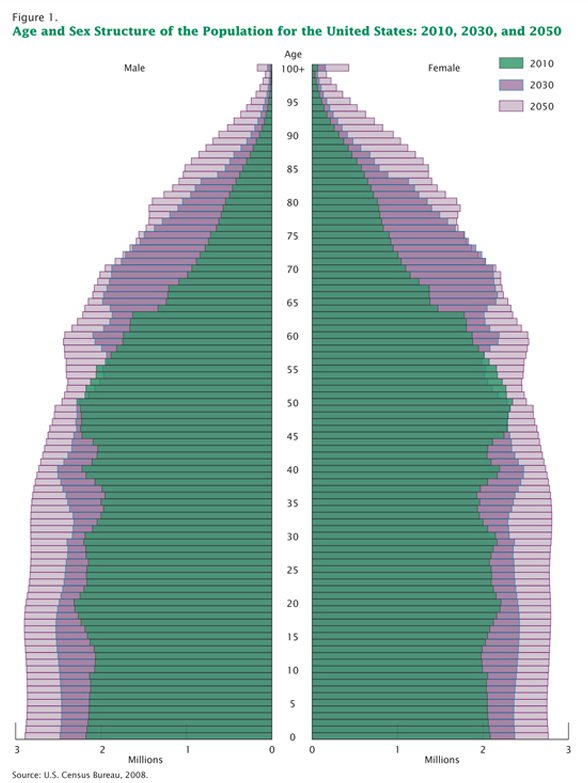
Coming back to what I think about visualizing the age structure of the American population. Call me old-fashioned, say that I adore my elders too much, I’ll just tell you we all stand on the backs of geniuses. I like the age pyramids for visualizing the age structure of a population. Here’s one I plucked from the Census website.

Population Aging in the United States | Traditional age pyramid graphic

The pyramid has these advantages:
   1. It shows gender differences. Males are on the left. Females are on the right.
   2. This graphic does a better job of showing the structure of the population because the older people appear to balance on the younger people. This is useful because the older people actually do kind of balance on the younger people when it comes to things like Social Security. The structure of the population does not come through in the area graph or the line graph. Both of those show us that there are more old people now than there were before but displaying more is a less sophisticated visual message than showing us just how many older people and how much older and how these things have changed over time. See all those and’s in the previous sentence? Yeah. That’s how much better the pyramid is.
   3. It is possible to see both the forest and the trees in this age pyramid. What do I mean? Well, the stacked area graph and the line graph had to lump rather large (and disproportionately sized) groups of ages together. In the age pyramid, the slices are even at every five years and if you happen to want to figure out just how the 20-24 year olds are changing over time, you can. But this granularity does not make it difficult to understand the overall structure of the pyramid.

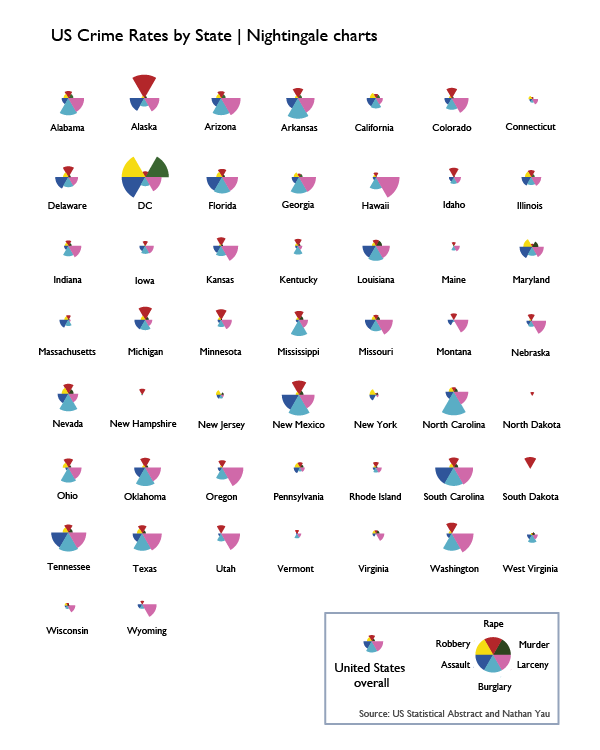
To summarize my larger disappointment, I wish that Yau had gone through a number of examples of displaying the same data with different graphics in order to teach readers how to choose the best graphic. To his credit, he did visualize crime data with a bunch of different graphics, but I didn’t like any of the graphic types. I’m including the one I liked most, but it’s mostly for historical reasons. This type of weird fanned out pie wedges is called a Nightingale chart and was developed in part by Florence Nightingale way back when information graphics didn’t exist. He visualized this same crime data with Chernoff faces and with star graphics, neither of which were interpretable, in my opinion.

US Crime Rates by State - Nightingale charts
US Crime Rates by State – Nightingale charts

Heatmaps

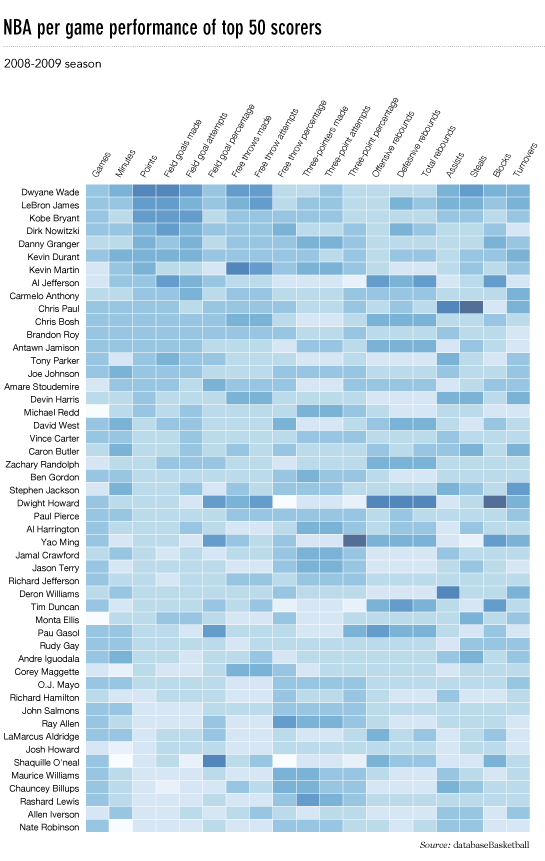
Unlike Chernoff faces, star charts, and Nightingale charts which I think are totally useless, heatmaps have promise as data visualizations. This is a good example of how I wished Yau would have started working hard to get the data to lash up better with the visualization. This is his final version of the heatmap of a whole bunch of different basketball game statistics with the players who were responsible for scoring, assisting, and rebounding (among many other things). I am a basketball fan. I went linsane last season. But I just do not get excited when I look at this heatmap because the visualization does not reveal any patterns. Ask yourself: would I rather have this information in a table? If the answer is yes, well, then you know there’s at least one other kind of representation besides this one that you would prefer if this is the data you are trying to display.

NBA heatmap via FlowingData

So what would I do? Well, I’d do a couple things. First, I would probably try restricting this heatmap to the top ten players or even to my favorite players. Throwing in 50 players and about 20 statistics per player without condensing anything means we are looking at 1000 data points. Ooof. So…if not cutting down the number of players, maybe put the scoring statistics in a different heatmap than all the other statistics (playtime, games played, rebounds, steals, blocks, turnovers, and so on). Maybe strip out the “attempts” and just leave the completed free throws, field goals, and three-pointers. I do not know if these things would have revealed patterns, I just know that the current graphic is still looking like a data soup to me.

Maps triumphant

Overall, this was a great how-to for data visualization and I want to end on an appropriately high note. One of the biggest wins in the book was Chapter 8 in which Yau walks us through the most meticulous and involved demo in the book. The payoff is big. He shows us how to use google maps and FIPS codes to make choropleths (these are large maps in which colors mated with numerical values fill in small, politically bounded units, usually counties but sometimes census tracts). He does not use ArcGIS which is one of the reigning mapping tools on the market. But ArcGIS is expensive. And Yau shows us how to generate maps without spending a dime. You will have to spend some time. If you are a cartography geek or you follow the unemployment rate, you’ve probably already seen this graphic because it was widely circulated, for good reason.

Unemployment map via FlowingData
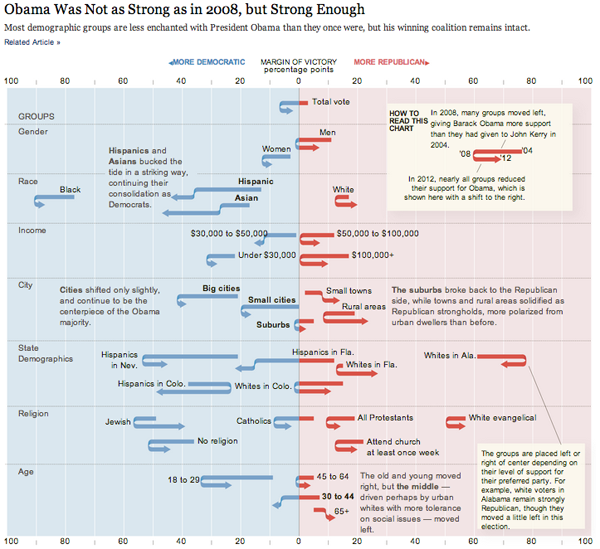
Patterns in political attitudes in US presidential elections from 2004-2012
Patterns in political attitudes in US presidential elections from 2004-2012 | By Amanda Cox, Ford Fessenden and Alicia Desantis nytimes.com

What works

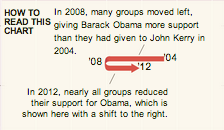
Legend
Legend

This graphic shows us data over time and is thus a kind of timeline but it uses a graphical device that I have never seen before – the U-turn arrow – to indicate changes in people’s political attitudes at three points in time. This works brilliantly for the dataset and is a strong argument for the use of design and designers in information visualization. A standard timeline would not have worked well with a dataset that has only three points in time that need to be represented for a plethora of categories (the categories are voting blocs in this case). The U-turn arrows allow us to see just how far various voting blocs moved from their 2004 position in 2008 and then again how far they moved in 2012. If the voters in these blocs became more liberal in 2008 and then slid back towards a more conservative position, the arrow makes a U-turn and it’s very easy to visually compare the length of the arms of each side of the U. If the particular voting bloc got more liberal in 2008 and continued towards an even more liberal position in 2012, the arrow does not make a U shape but it still has a kink in it at 2008 so that we can visually compare the length of the 2004-2008 section to the 2008-2012 section. The use of this type of U-turn/kinked arrow is new to me and it’s just brilliant. It’s one of those things that is so easy to understand immediately that we forget we’ve never seen it before. That’s the mark of smart design.

The other thing that this style of timeline does so well is that it allows variation on the starting points of the different voting blocs along the horizontal axis. We get to see that some groups are so far over in the liberal or conservative camps they may never be ‘in play’ and other blocs have voting patterns that push them over the critical boundary in the center of the graphic.

If this type of data were represented on a line graph, the variation in liberal vs. conservative might have been plotted on the vertical axis (though, hopefully this graphic makes it clear that chart conventions can be kicked to the curb at any point in time). Visually, I like the liberal/conservative spectrum better horizontally because it plays with the left-right semantics that are already used to discuss political beliefs.

What needs work

We need more designers working in visualization departments so that we end up with graphics like this that are tailored exactly to the structure of the data and the story it tells rather than trying to select from an existing conventional data representation type.

Kudos to Amanda Cox, Ford Fessenden, and Alicia Desantis at the New York Times.

References

Cox, Amanda; Fessenden, Ford; and Desantis, Alicia. (2012) Obama Was Not as Strong as in 2008, but Strong Enough. [information graphic] New York Times.

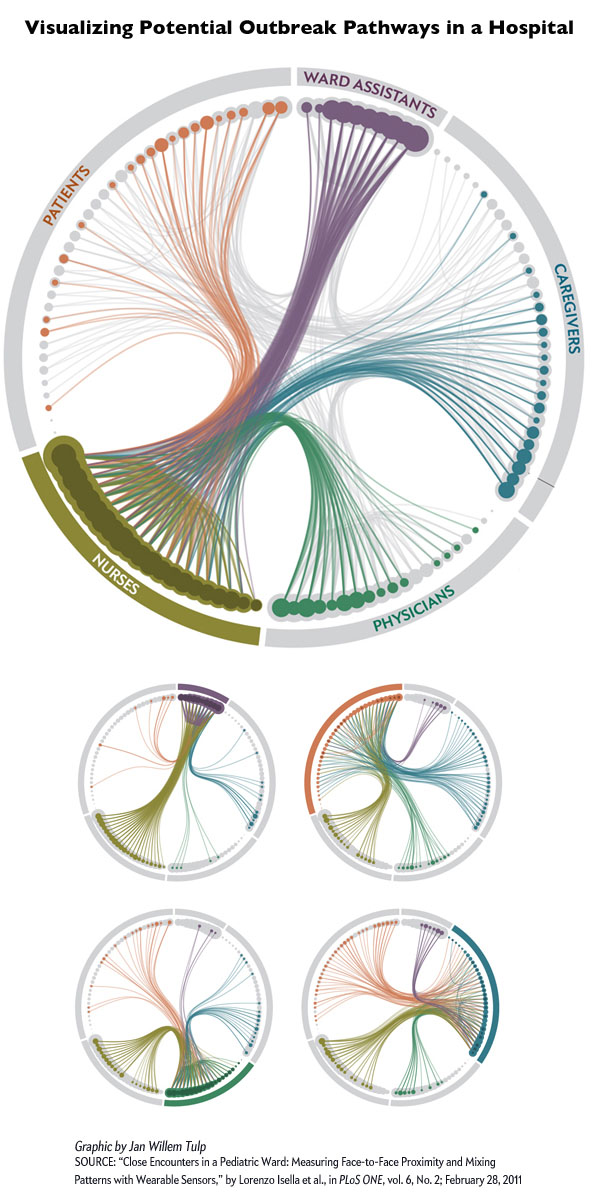
Visualization of outbreak pathways in a hospital
Visualization of outbreak pathways in a hospital | Scientific American, Graphic by Jan Willem Tulp

What works

Using RFID tags worn by hospital staff and patients at the Bambino Ges&#uacute; pediatric hospital in Rome, researchers with the SocioPatterns group tracked interaction patterns to help understand how nosocomial illnesses spread. Nosocomial infections are infections patients and hospital staff contract while they are in the hospital. According to wikipedia, about 10% of patients in hospitals in the US contract some kind of nosocomial infection every year; the most common infection is the urinary tract infection (36%).

The RFID tags were distributed to 119 individuals to tally up each person’s encounters with anyone who came within 1.5 meters for a minute or more. Of course, this generated a great deal of data. The graphic above does a good job of condensing the data into a single image – well, actually, there is one image for each category of person in the hospital and it is important to look at all five images for full analytical impact. Click on the graphic to go to Scientific American and see them all.

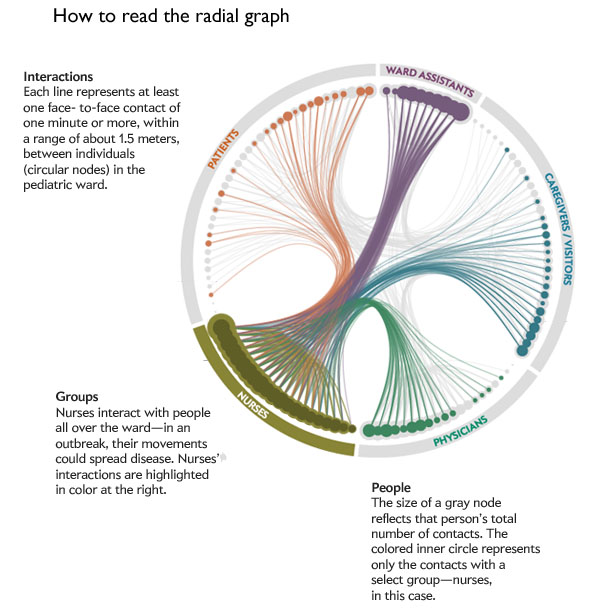
Legend for reading the radial graph of outbreak pathways in a hospital
Legend for reading the radial graph of outbreak pathways in a hospital | Scientific American, Jan Willem Tulp [graphic]

Somewhat unsurprisingly, nurses proved to be the most well-connected people in the hospital. They interact frequently with each other and with every other category of person: patients, ward assistants, doctors, and care givers. Even though I said this finding was “unsurprising” it is extremely important to have solid data supporting what seem to be obvious findings. For instance, imagine you had not read the previous paragraphs or looked at the graphics and I had written: “Unsurprisingly, doctors proved to be the most well-connected people in the hospital, interacting frequently with patients, care givers, nurses, and ward assistants”. It sounds almost as logical as what I wrote about nurses (quite frankly, I would have found it hard to believe that doctors interact frequently with ward assistants). The point is, before data exists, it is easy to convince ourselves that a variety of different logical scenarios are playing out. The RFID methodology was a wise choice because it did not rely on self-reports. Self-reports are tough because they ask responders to remember all their contacts AND to be unbiased about reporting them. Some encounters in hospitals are more valued than others. Contacts with patients are valuable because patient care is the manifest purpose of a hospital and would thus be more likely to be reported than, say, standing next to another nurse at the bathroom sink or urinal for a minute.

What needs work

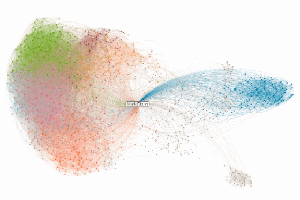
Radial graphs, to me, are difficult to read. The science of networks is still what I would call an emerging field in the sense that both the methodologies and the techniques for analyzing data are not yet fixed. New strategies are still being developed at a relatively rapid rate. I think there might be a better way to present the data than the above radial graph, but the radial graph is a huge step ahead of the messy network nests that used to dominate the presentations/analysis of network research.

Messy nest network visualization
Nest visualization technique. Even with the colors it’s hard to make sense of the cluster on the left.

Here’s where I am having a hard time making sense of the radial graph. First of all, I didn’t get the immediate impression that nurses were the network hubs holding this whole situation together. I had to click through each of the five graphics twice to ‘see’ the finding that nurses are more well-connected than others in the network. Even then, it would have been relatively easy to make a mistake and think that ward assistants were just about equally important (and maybe they are!) because the dots representing their total contacts are just as large and somewhat more tightly clustered than the dots representing the nurses total contacts. However, the size of the dots records only total contacts and it seems that ward assistants have a great deal of contacts with each other (perhaps they work in teams?), but relatively little contact with patients or physicians. But the lines representing that data are faint compared to the weight of the dots making that part of the data analysis seem secondary, which is not the case.

I don’t have a great solution to the radial graph visualization of networks situation. To me, it seems like it is a huge step beyond the messy nests that used to be the go-to for network visualization but not yet fully baked as the gold standard.

References

Matson, John. (November 2012) RFID tags track possible outbreak pathways in the hospital Scientific American.
Note: The official date on the above source is 15 November 2012 but since it is only 4 November 2012, I left the day out of the date field.

Graphic by Jan Willem Tulp; Source: “Close Encounters in a Pediatric Ward: Measuring Face-to-Face Proximity and Mixing Patterns with Wearable Sensors,” by Lorenzo Isella et al., in PLoS ONE, vol. 6, No. 2, article e17144; 2011

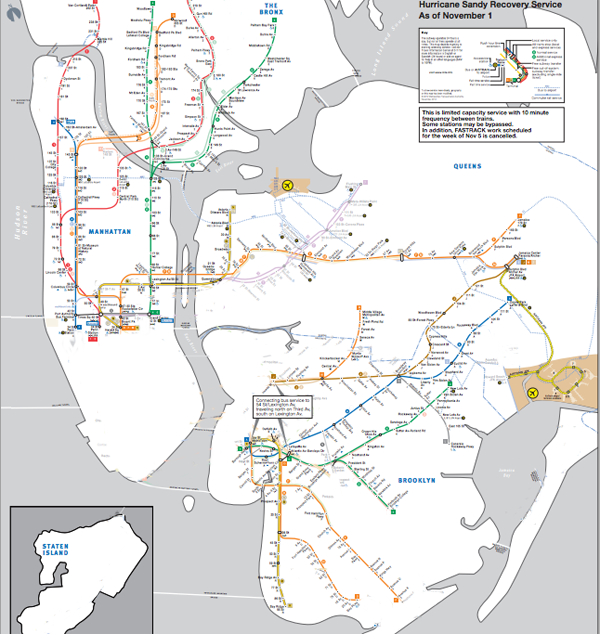
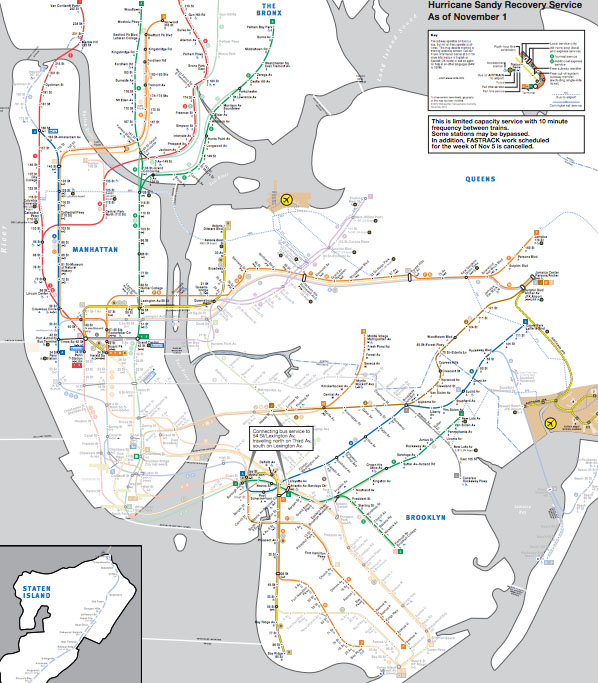
New York City subway map after Sandy

New York City subway map, Hurricane Sandy hangover map

New York City ghosted lines subway map

New York City subway map
New York City subway map with all of the lines ghosted in

Not back to normal

For those of you living in New York, the subway map is probably familiar to you. For those who are not here, but are listening to reports, I thought I would post the maps to illustrate that the subways are not back to normal. The national broadcasts I listen to keep mentioning that the subways are coming back, which is true, but Sandy essentially knocked the center out of the network. What was once one network is now two networks with very strange structures. They connect, if at all, not through their abdomens like spiders’ legs, but at the very ends of their extremities and there is no recognizable abdomen.

The storm also knocked out some specific edges of the network, like the end of the A train that ran past JFK and into the Rockaways. Note to travelers: The New York City subway is no longer connected to JFK airport.

As of this morning, I am hearing different reports about the 7 train in Queens. It might be running to the connection with the F train according to WNYC, but the mta.info website does not yet reflect that change. I left the line partially ghosted in. There are no reports that the 7 train is running all the way into Manhattan.

Brooklyn

There is subway service between Queens and Manhattan but Brooklyn has been cut off almost completely.