Search results for Gender wage gap

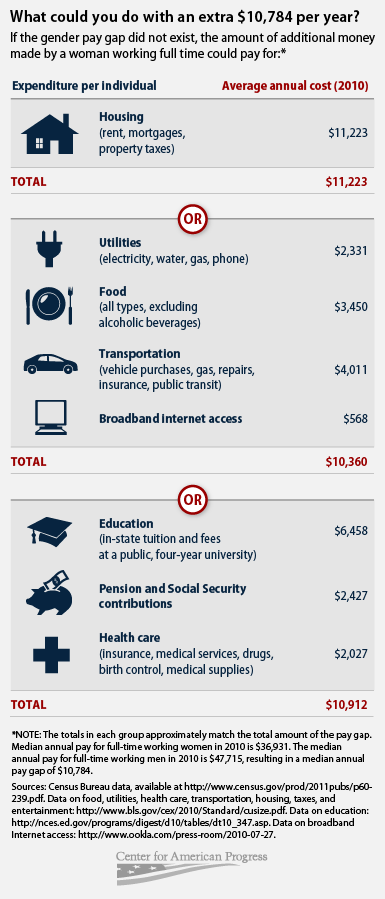
While income inequality between the sexes has decreased in recent decades, women still only make seventy-seven cents for every dollar a man is paid. Matt Separa from the Center for American Progress illustrated what could be bought with those lost wages to help us conceptualize how wide the wage gap is.

His first chart shows how the $10,784 in underpaid wages would almost cover annual housing costs or could pay the combined costs of a year’s worth of utilities, food, transportation, and internet access with a few hundred dollars to spare. The lost wages could also almost pay all the expenses for annual in-state tuition at a public university, twelve months of contributions to Social Security, and basic medical care for a year:

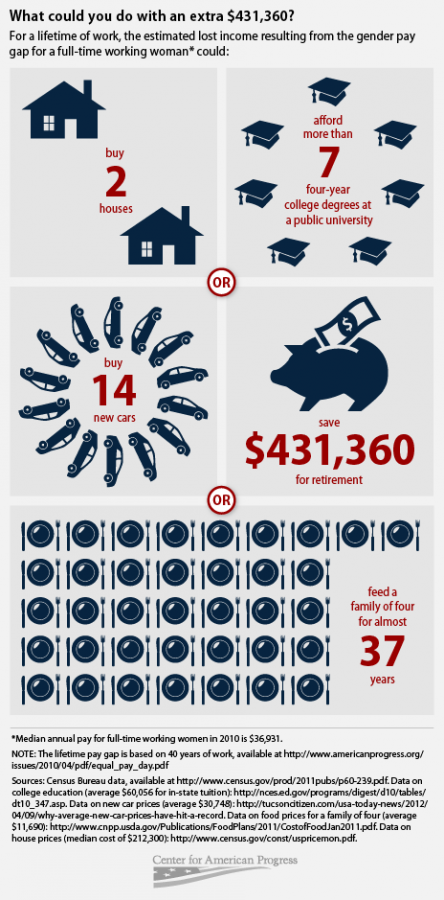
His second chart illustrates how across a lifetime, the lost wages ($431,360) could buy two houses, seven degrees from public universities, fourteen cars, or pay for a family of four to eat for thirty-seven years.   Many of Spera’s examples, including real estate, tuition and retirement savings, are especially powerful because they show how the lost wages could be turned into capital and wealth that would pay even more dividends on top of the lost income:

Overall, the graphs do a nice job of making the implications of the gender wage gap concrete.

—————

Jason Eastman is an Assistant Professor of Sociology at Coastal Carolina University who researches how culture and identity influence social inequalities.

Course Guide for
SOCIOLOGY OF GENDER
(last updated 09/2011)


Developed by Mary Nell Trautner, PhD
University at Buffalo, SUNY


Social Construction of Sex & Gender

Intersexuality


Patriarchy / Oppression

Patriarchy as Male Dominated

Patriarchy as Male Identified

Patriarchy as Male Centered


“Doing Gender,” Gender as Performance


Intersectionality

White privilege


Childhood Gender Socialization


Gender & Language


Gender & Mass Media


Gender & Work

The Wage Gap


Gender & Sports


Sexuality: Homophobia


Sexuality: Sexual Behavior


Gender & the Body

Physical appearance and beauty work

Obesity and overweight


Gender and Family


Hegemonic Masculinity


Intimate Partner Violence


Sexual Harassment


Forced Sex & Sexual Assault

Anti-Rape Campaigns


Visions for the Future

If you would like to write a Course Guide for Sociological Images, please email us at socimages@thesocietypages.org.

Cross-posted at Scientopia.

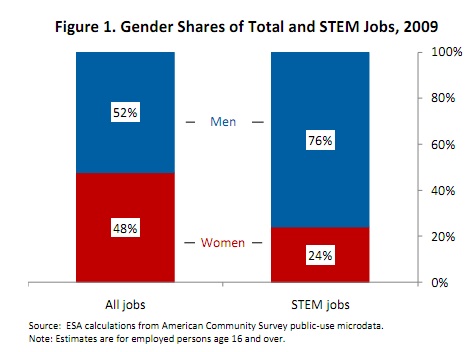
The U.S. Department of Commerce just released a report on the continuing gender gap in STEM jobs – that is, science, technology, engineering, and math. While women make up roughly half of the total paid workforce, they still held only a quarter of STEM jobs as of 2009:

In fact, we saw no change in the gender make-up of STEM fields between 2000 and 2009.

There is significant variation in the gender composition within the STEM category, however. At the high end, women hold 40% of jobs in the physical and life sciences; the low point is engineering, where only 14% of employees are women. And the proportion of women in computer science and math jobs actually fell between 2000 and 2009, from 30% to 27% of workers.

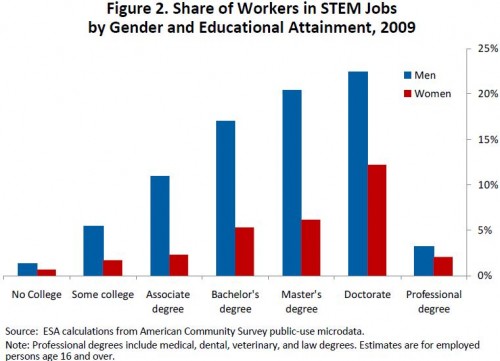
This isn’t simply because of differences in education, either. Here we see the proportion of both men and women in STEM jobs at various educational levels; while increased education correlates with a higher likelihood of having a STEM job for both groups, women are significantly less likely than men at every educational level to have a STEM job:

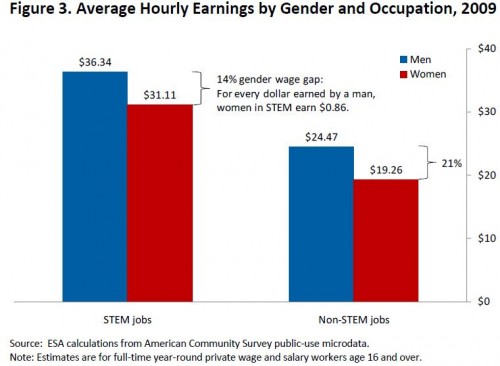
The gender disparity in STEM jobs is especially noteworthy because, on average, STEM occupations pay significantly more than other private-sector jobs, and the gender gap in pay is actually lower than in non-STEM sectors:

If we look only at women with bachelor’s degrees, women who earn STEM degrees and work in STEM jobs earn, on average, 29% more than other women.

So the underrepresentation of women in STEM jobs means that women are missing out on some of the best-paying occupations in the U.S.; in fact, this type of gender-segregation of jobs is one of the leading causes of gender gap in yearly and lifetime earnings.

The authors of the report don’t go into detail about potential causes of the gender gap in STEM careers, though they note that among those earning STEM degrees in college, women are significantly less likely than men to hold jobs in related STEM fields. They suggest this might be because STEM jobs are relatively unaccommodating to those who take time off for family obligations (disproportionately women), because of a lack of female role models in STEM fields (including as college professors), or because of gender stereotyping about math or science aptitude (like this, or this if you prefer a t-shirt) that pushes women away from STEM degrees and careers. [UPDATE: Broken links fixed!]

The complex interplay of factors that lead to a gender gap in who holds STEM-sector jobs provides significant challenges to increasing the proportion of women in these occupations — as indicated by the lack of change over the past decade. But particularly as we see increasing economic divergence between well-paid tech and information sector and low-paid service sector jobs, addressing the underrepresentation of women in STEM jobs will be essential as part of any effort to improve women’s lifetime earnings potential and overall economic outlook.

Philip Cohen posted some interesting data at his blog, Family Inequality, that I think will look at first blush, counterintuitive to many.  The figure below shows the percent of men’s income that women bring home, organized by age bracket and level of education.  The top bar, for example, tell us that, among 45-50 year olds with advanced degrees, women make 68% of what men do.

Two observations:

First, notice that women with more education (the lighter bars in each age bracket) do worse compared to men than women with less education.  That is, the gender inequity is worse in the upper classes than it is in the lower classes.   Why?  Well, people tend to marry other with similar class and education backgrounds.  Accordingly, women with more education may be married to men with higher earning potential than women with less education. Those women are more able to make work-related choices that don’t foreground economics, since their income is less central to the financial health of the couple.  They are also more likely to take substantial amounts of time out of the workforce when they have kids (working class women can’t afford to do so as easily), and we know that doing so makes a real dent in career advancement.  So, perhaps ironically, women who are “richer” educationally may marry economically richer men who then allow them to deprioritize their careers.

Second, notice that the most equal incomes (where women make 85% of men’s salaries) occurs among the youngest and least educated group: 25-34 year old high school drop outs.  Why would younger women do better relative to men than older women?  Some of this may be due to a decrease in gender-based discrimination.  But it also likely has something to do with the devaluation and disappearance of traditionally working-class men’s work.  Most of the narrowing of the gender wage gap, in fact, has to do with the lowering of men’s earning power to meet women’s, not vice versa.  As the industrial base in the U.S. has been collapsing, the number of historically-male blue collar jobs have been shrinking.  Meanwhile, our industrial economy has been replaced by one split between (well compensated) information/technology and (poorly compensated) service jobs.  Those service jobs are going disproportionately to women.  So, while men still dominate (especially the most well-regarded and well-compensated) upper class professions, their dominance in the lower rungs of the economic ladder is waning.

Thanks again to Philip Cohen for the data!

Lisa Wade, PhD is an Associate Professor at Tulane University. She is the author of American Hookup, a book about college sexual culture; a textbook about gender; and a forthcoming introductory text: Terrible Magnificent Sociology. You can follow her on Twitter and Instagram.

an average looking washroom sign where the men's and women's  washrooms are indicated with stick figures

Women’s and men’s washrooms: we encounter them nearly every time we venture into public space. To many people the separation of the two, and the signs used to distinguish them, may seem innocuous and necessary. Trans people know that this is not the case, and that public battles have been waged over who is allowed to use which washroom. The segregation of public washrooms is one of the most basic ways that the male-female binary is upheld and reinforced.

As such, washroom signs are very telling of the way societies construct gender. They identify the male as the universal and the female as the variation. They express expectations of gender performance. And they conflate gender with sex.

I present here for your perusal, a typology and analysis of various washroom signs.

[Editor: After the jump because there are dozens of them… which is why Marissa’s post is so awesome…]

more...

Caroline P. sent in this stunning example of gendered socialization, gendered job segregation, and the social construction of skill.  Notice that the two photos below show an “electronic medical set” for a doctor and a nurse, with a photo of a boy and a girl, respectively.

spa0269hspa0268v

Okay, so the jobs are gendered.  But more than that, notice that the sets contain essentially the same toys: a stethescope, pill bottle, syringe, thermometer, mirror, hot water bottle, clipboard, blood pressure thingy, and whatever that is in the bottom right corner.

So it’s more than just gendered jobs, it’s an acknowledgement that when boys and girls do the same job, it gets called something different and, more, better compensated when men do it.  We see this with other, real jobs that get split into gendered categories like janitor/maid.

Lisa Wade, PhD is an Associate Professor at Tulane University. She is the author of American Hookup, a book about college sexual culture; a textbook about gender; and a forthcoming introductory text: Terrible Magnificent Sociology. You can follow her on Twitter and Instagram.

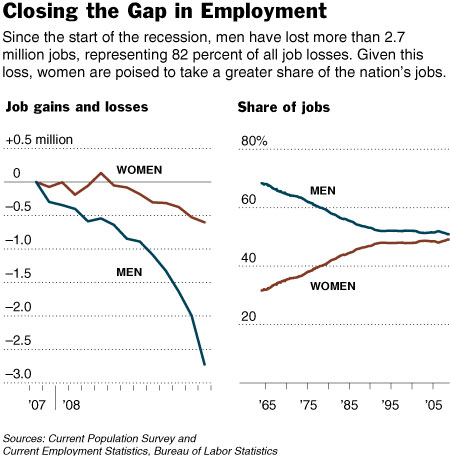
This week in the New York Times, Catherine Rampell explained how the recession was affecting the ratio of female to male workers:

The proportion of women who are working has changed very little since the recession started. But a full 82 percent of the job losses have befallen men, who are heavily represented in distressed industries like manufacturing and construction. Women tend to be employed in areas like education and health care, which are less sensitive to economic ups and downs, and in jobs that allow more time for child care and other domestic work.

Here are the results:

06women-graf01

Excluding farm workers and the self-employed, women held 49 percent of the nation’s jobs as of November. Including farm workers and the self-employed, women held 47 percent of jobs.

But, Rampell reminds us:

Women may be safer in their jobs, but tend to find it harder to support a family… Women are much more likely to be in part-time jobs without health insurance or unemployment insurance. Even in full-time jobs, women earn 80 cents for each dollar of their male counterparts’ income…

If the recession continues as it has, the U.S. workforce may soon be majority female.

See also this post on job segregation.

A main source of the wage gap between men and women is job segregation.  Men and women are sorted into different jobs and jobs associated with women are paid less.

Below is a list of occupations and their average wages for 2007 from The Bureau of Labor Statistics.  I picked out occupations that were rather straightforward (not a random sample, just an illustrative one), put them in order from lowest to highest, and colored them according to whether they are feminine (pink) or masculine (blue) occupations.  Comments below.

Parking Lot Attendants:  $8.82
Child care workers:    $8.82
Coatroom attendants:   $9.18
Bellhops:  $9.25

Sewing machine operators:   $9.31
Manicurists and pedicurists:   $9.60
Home health care aid:  $9.62

Stock clerks:   $9.85           
Janitors:   $10.00

Hairdressers:  $10.68
Security Guards:  $10.85
File clerks:  $11.06

Pre-school teachers:  $11.12
Barbers:  $11.31
Receptionist:  $11.40
Bus Driver (school):   $12.43
Construction workers:   $13.13
Butchers:   $13.87

Dental Assistants:   $15.17
Bus Driver (city):   $15.94
Roofers:   $15.98
Car mechanics:   $16.43
Truck drivers:   $17.41
Electricians:   $21.53

1. Notice that feminized occupations, occupations that are disproportionately female, cluster towards the lower wage end of this hierarchy.  

2. Notice also that, were we to rank these occupations in order of importance or difficulty, we might come out with a very different ranking.  Importance and difficulty does not necessarily translate into wages. 

For example, child care workers and home health care workers are paid only a bit more or no more than parking lot attendants. And coatroom attendants are paid more. So coats and cars are, I guess, pretty important.

Car mechanics are paid more than dental assistants.  They require a similar amount of training, yet we still pay those taking care of our cars more than those taking care of our teeth.

And pre-school teachers are paid less than butchers and bus drivers.  Is preparing our children for school less important than getting them there?  Do we value the man preparing our meat more than we value the woman tending to our child?

3. Finally, notice that some jobs come in gender specific forms and the feminized form is paid less. For example, maids are paid less than janitors and hairdressers are paid less than barbers.