agriculture

Visualizing How A Population Grows To 7 Billion | NPR [Click for video]
Visualizing How A Population Grows To 7 Billion | NPR {Click for video}

What works

This video does an excellent job of explaining how population growth has happened with beautiful visualizations. Click through to watch it. It’s worth it.

Visualizing How A Population Grows To 7 Billion | NPR [Click for video]
Visualizing How A Population Grows To 7 Billion | NPR {Click for video}

What comes next

It would be nice to have a visualization that could combine population growth visualizations with quality of life visualizations. Quality of life was pretty dismal in the beginning – infant mortality was high, maternal death was high, life times were short and much more of them were spent in grueling conditions. The rising tide of domestic agricultural practices raised all boats. But then quality of life started to become stratified – some people in some places had it pretty good while others were still facing not such great conditions. Now quality of life is extremely stratified but starting to diminish globally and will continue to diminish as the impacts of climate change set in (not to mention the non-climate related concerns associated with what happens when the planet starts to reach its limit in terms of how many human lives it can support at high levels of ‘quality of life’). Fewer people will be able to eat meat regularly (which may or may not be considered an indicator of high quality of life), more people will get asthma as we all move to cities congested with the exhaust of internal combustion engines and coal-fueled power plants, more people will live in drought stricken places, and more people will end up in conditions of poverty if rates of inequality continue as they are.

The video is beautiful as it is. But the beautiful polish helps obscure the notion that population growth is not necessarily a good thing.

References

Cole, Adam and Starbard, Maggie. (31 October 2011) Visualizing how a population grows to 7 billion. NPR.org.

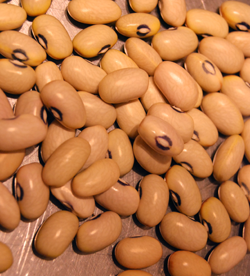
Beans
Beans

Overview

On Tuesday I read “When One Farm Subsidy Ends, Another May Rise to Replace it” OR “Farmers Facing Loss of Subsidy May Get New One” by William Neuman [aside: why does the NY Times frequently have two titles for the same article? One appears in the title tags in the html and in the URL, the other appears at the top of the article as it is read]. The upshot of the article is that the subsidies appear to be curtailed as cost-saving measures but come right back under new names:

It seems a rare act of civic sacrifice: in the name of deficit reduction, lawmakers from both parties are calling for the end of a longstanding agricultural subsidy that puts about $5 billion a year in the pockets of their farmer constituents. Even major farm groups are accepting the move, saying that with farmers poised to reap bumper profits, they must do their part.

But in the same breath, the lawmakers and their farm lobby allies are seeking to send most of that money — under a new name — straight back to the same farmers, with most of the benefits going to large farms that grow commodity crops like corn, soybeans, wheat and cotton. In essence, lawmakers would replace one subsidy with a new one.

Neuman also interviewed Vincent H. Smith, a professor of farm economics at Montana State University who, “called the maneuver a bait and switch” saying,

“There’s a persistent story that farming is on the edge of catastrophe in America and that’s why they need safety nets that other people don’t get. And the reality is that it’s really a very healthy industry.”

My curiousity was piqued, to say the least. Farm subsidies have long been an emotionally charged issue – Professor Smith is right to point out that the family farmer is an icon in the American zeitgeist whose ideal type gets trotted out as a narrative to support subsidies that often go to large-scale corporate agriculture. Before mounting my own angry response to what appears to be both hypocritical and a well-orchestrated marketing schmooze (ie the public proclamation by various farm lobbies that they are willing to take fewer subsidies as they band with the rest of the beleaguered American public in a collective belt-tightening process while simultaneously opening up other routes to receive the same amount of funding through different mechanisms), I decided to go in search of some hard data to see what is going on with agricultural subsidies.

Agricultural data

I found two great sources of data. First, the USDA runs the National Agricultural Statistics Service which publishes copious amounts of tables full of information about how much farmland there is in the US, what is grown on it, what the yields are, what commodity prices are, what farm expenditures are doing, and all sorts of rich information. Linked from the article was another source of data – the Environmental Working Group – which has been tracking farm subsidies for years. The Environmental Working Group also relies on the National Agricultural Statistics Service, especially for farm subsidy information. Between those two sources, the US Census, and the 2012 US Statistical Abstracts (Table 825 especially), I had more than enough information to start putting together a graphic that could describe at least part of what is going on with agricultural subsidies.

Selecting the right data

Because farming is distributed unevenly around the country, I knew I needed to come up with a set of numbers that went beyond absolute dollar amounts per state. Probably it would have been nice to see where subsidies go per crop, but other people have already done that.

To look at agricultural subsidies overall, and to work with the state-by-state data that I had, I ended up considering three approaches.

  • 1. Absolute commodity subsidy amounts per state.
  • 2. Commodity subsidy amounts per capita.
  • 3. Commodity subsidy amounts per farmland acre.

It is obvious that the third option, looking at the amount of spending per acre within each state, is the best.

Hypothesis

I expected to find that states with small amounts of farmland would be relatively more expensive per acre than states with large amounts of farmland. I assumed there would be economies of scale and that states with very large amounts of farmland probably had a lot of that land dedicated to pasture, which is pretty cheap to maintain compared to something like an orchard.

Attempt Number 1

I decided that simply showing the costs per acre might not be as interesting as keeping the absolute amount of farmland in play and doing some kind of comparison.

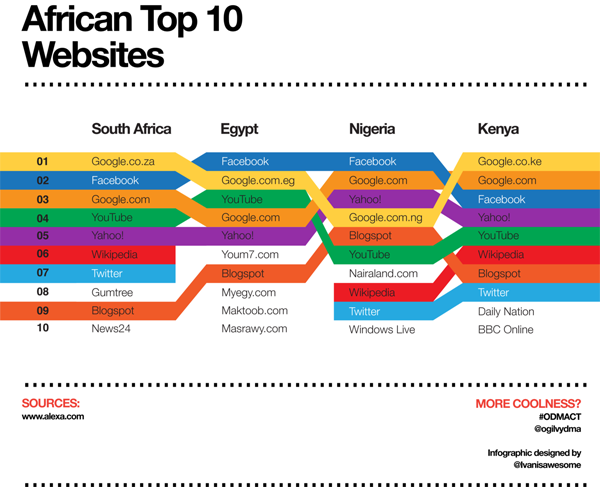
Rank comparisons are extremely popular and I admit I was sucked into them, though now that I’ve tried to make them, I kind of hate them. These are the kinds of comparisons that you’ll hear on the news – Ohio ranks Yth in per capita income but Zth in educational spending per pupil – and see in graphics that often look like this:

Top Ten Websites in Four African Countries | Ivanisawesome

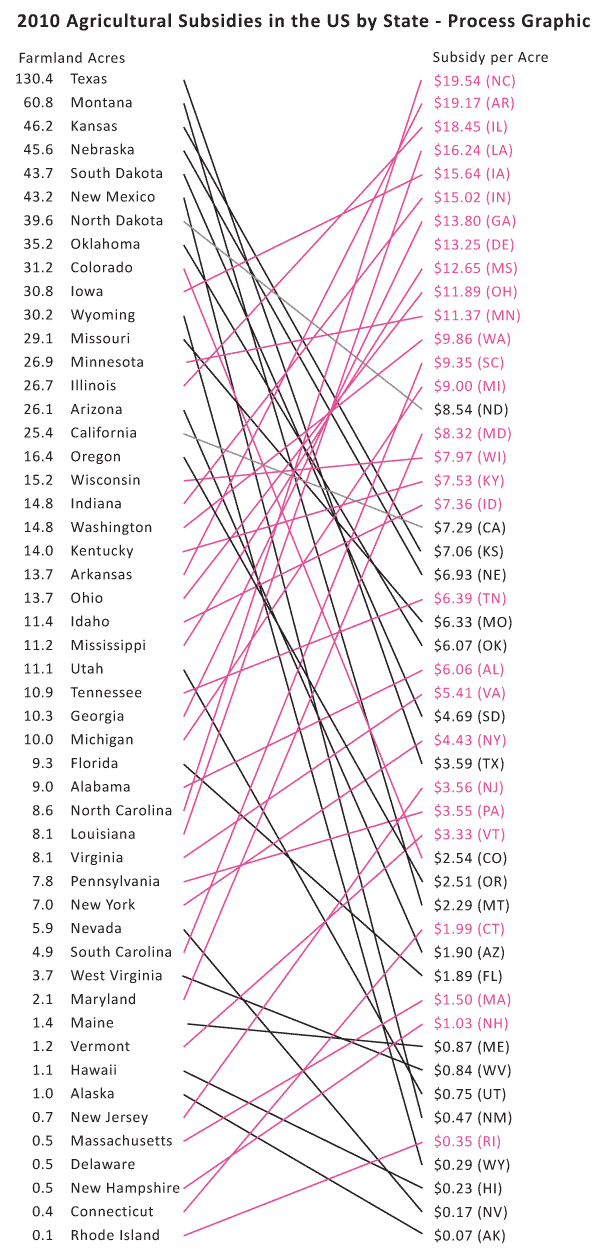
My first attempt to do something similar looked like this.

US Agricultural Commodity Subsidies | Process Graphic 01

Here are my problems with it:

  • There is no obvious pattern – it looks like a rat’s nest.
  • The states with bad ratios – the ones where we are paying more than $10/acre – have upward sloping lines connecting them from the left column to the right column. Psychologically, the ‘bad’ deals should have downward sloping lines. It just makes better visual sense.
  • Pink was supposed to be along the lines of red on accounting sheets but it looked too cheery to indicate being ‘in the red’.

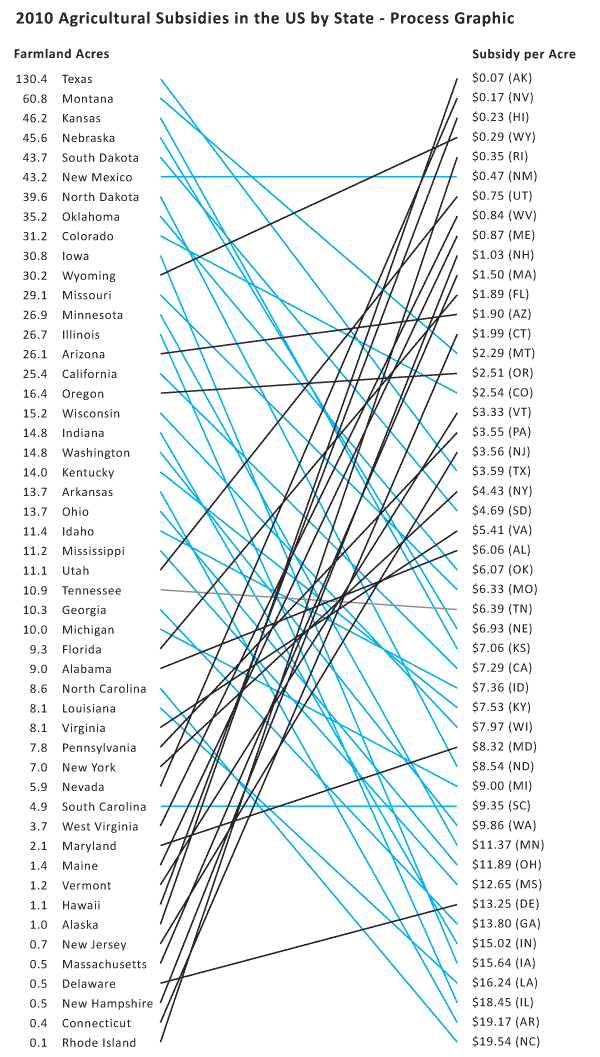
Attempt Number 2

US Agricultural Commodity Subsidies - Process Graphic 2

I got rid of the pink altogether and flipped the scale on the left so that the best deals – the lowest per acre subsidy costs – are at the top. This means that states that are taking less per acre end up having upward sloping lines more often than downward sloping lines.

Thinking through this brought up some larger concerns. Comparing by rank alone is ridiculous. The space between each listing in both columns is extremely critical in a graphic like this and needs to be scaled appropriately. For instance, look at Alabama ($6.06) and Oklahoma ($6.07) in the right hand column. They basically have the exact same amount of spending per acre and yet they are the same distance apart as Washington ($9.86) and Minnesota ($11.37). The same problem happens in the lefthand column – states with about the same amount of acreage dedicated to farmland have the same distance between them as states with large differences in the amount of acreage they have dedicated to farmland.

Attempt 3

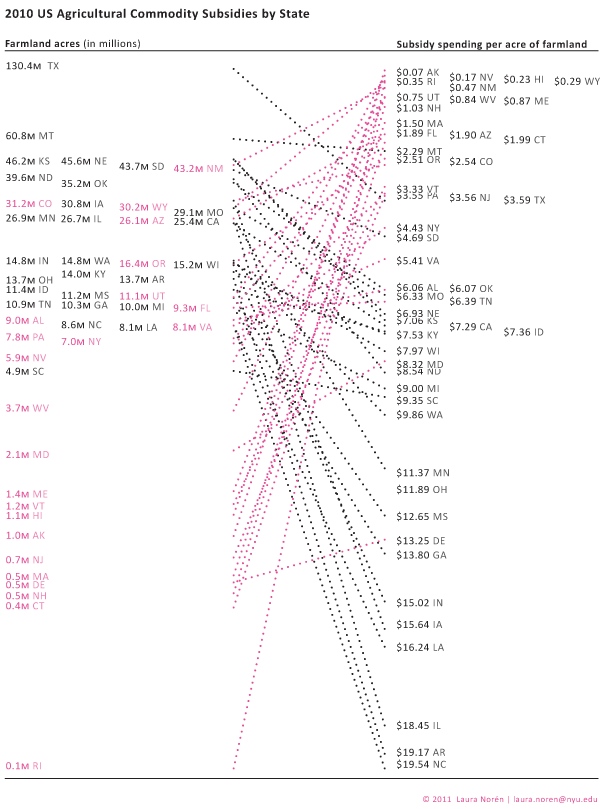
US Agricultural Commodities by State, 2010

Click here to see a pdf of the whole graphic.

I scaled both the right and left hand columns using a log scale for farmland acreage (though the number of acres is still given in absolute millions of acres – only the visual arrangement was logged). The pattern is still messy and hard to discern, though clearer than in previous versions. In order to bolster the pattern, I turned the ‘good deals’ in the lefthand column pink. The states with less acreage dedicated to farmland routinely receive less subsidy per acre than some of the bigger states. But the very biggest farming states – like Montana and Texas – are also pretty affordable on a per acre basis. It was states near the middle of the pack that were coming in at $18 and $19 per acre of commodity subsidy spending.

I thought maybe it was a weather event that led to some of the larger subsidies. But if that were the case, states that were geographically near one another would probably have had the same drought/hurricane/flood and should have received similar funding. There is work to be done on the weather question – looking at data over time would be a good step in the right direction there.

However, I don’t know that weather is going to be the best answer to this question. Look at Washington and Oregon. They are geographically right next to each other, grow some similar kinds of things, and have a similar amount of farmland acreage yet they have dramatically different amounts of subsidy spending per acre. Washington takes $9.86 per acre; Oregon gets $2.51 per acre. It’s still unclear why there is such a great disparity between these two states in 2010.

Falsified hypothesis

Through the construction of this information graphic, I falsified my own hypothesis. The states with the smallest amount of land dedicated to farmland received the least amount of commodity subsidies.

I have some thoughts about what is going on. They will require more data analysis and graphic development to suss out and represent completely.

    New Hypotheses

  • 1. It’s the weather. It could still be the weather. I did not do enough investigation into this variable, though this seems like a weak hypothesis.
  • 2. It’s corn. The states that grow a lot of corn seem to get more subsidies. This hypothesis could easily be expanded to be something more sophisticated such as: “Subsidies per acre are sensitive to the commodity grown.”
  • 3. It’s lobbying. The states that are known to be “big farm” states seem to have more funding than smaller farm states. Maybe they are better represented by the farm lobbies and therefore end up with more subsidy per acre than states without strong representation from the farm lobby. This hypothesis has an overlap with the “it’s corn” hypothesis.

Conclusion

There are two kinds of conclusions to be drawn. On the agricultural front, it is safe to conclude that Americans spend a good bit of money per acre of farmland; there is no free market on the farms. Bigger states do not offer economies of scale compared to states with less farmland acreage. No additional conclusions can be drawn from this limited data, though interesting hypotheses can be posed about the influence of local weather events, funding for specific commodities like corn, and the impact of lobbyists efforts on agricultural funding allocations.

As a graphic exercise, I hope I have proven that rank orderings do not offer much analytical value on their own. I hope I have also suggested that graphics can be used not only for representing findings at the end of the process but for discovering patterns. Graphics are not just for display, they are also for discovery.

References

Neuman, William. (2011, 17 October) “When One Farm Subsidy Ends, Another May Rise to Replace it” Business Section, nytimes.com.

Noren, Laura. (2011) US Agricultural Commodity Subsidies by State, 2010“US Agricultural Commodity Subsidies by State, 2010” [Information graphic] and [Data Table – this is a combination of data and analysis originally published by the National Agricultural Statistics Service, a public-facing branch of the USDA].

Environmental Working Group a good source for information on agricultural subsidy spending.

United States Census Bureau, Statistical Abstract of the United States (2011) Agriculture.

United States Department of Agriculture, National Agriculture Statistics Service

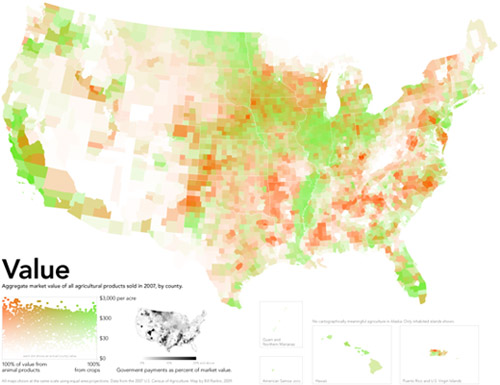
American Agricultural Value map | Bill Rankin, Radical Cartography
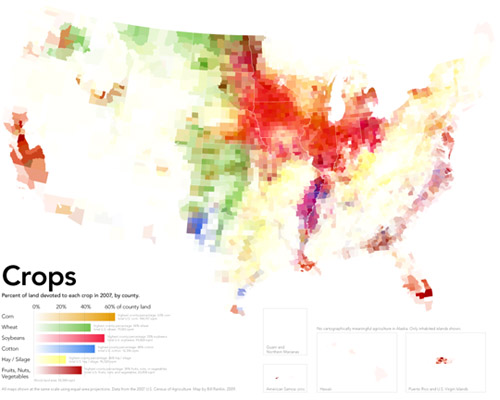
American Cropland map | Bill Rankin, Radical Cartography
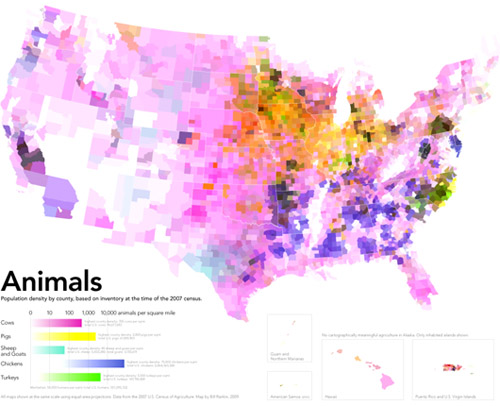
American livestock map | Bill Rankin, Radical Cartography

What works

Produced by Bill Rankin, Assistant Professor of History of Science at Yale University and editor/graphic designer at Radical Cartography, these three maps work together to show how American agriculture is organized both spatially and economically. [Click through to Radical Cartography to see much bigger versions. Since that site is in Flash, I can’t embed links that take you directly to the big versions. Once you get to Radical Cartography click: Projects -> The United States -> Animal/Vegetable.] The top map here is the dollar value combination of the cropland and livestock areas in the US. For activist types, what’s even more exciting is the small black and white inset map that takes into account federal agriculture subsidies. The next two maps were combined to produce the top map – one shows how cropland is distributed, the other displays the distribution of livestock.

Bill Rankin is a rigorous researcher with a background in history and the thing he does best here is context. In order to understand the top map – which is what I believe Prof. Rankin wants viewers to store in their memory banks as the critical take-away – he first shows us how cropland and livestock land are distributed and then layers them over one another to show us how they are differentially valued. This type of data is sensitive to geography and location in two ways: 1. crops are sensitive to elements of geography like climate and available water supplies – there are no crops growing in the dessert of the American southwest 2. because the US hands out a variety of agricultural subsidies, the political boundaries of states have to be seen in conjunction with the crop distribution in order to understand how the political levers lead to the current subsidy scenario.

What needs work

The approach he takes is to color each county based on the percentage of area covered by a particular crop. This means that counties with multiple crops will end up with blended color values. For instance, cotton is coded blue and ‘fruits, nuts, and vegetables’ are coded maroon. This means that in some southern counties growing roughly equal amounts of cotton and ‘fruits, nuts, and vegetables’ the counties are neither blue nor maroon but purple. But wait. The blue of cotton might have combined not with the maroon of ‘fruits, nuts, and vegetables’ but with the brighter red of soybeans to produce that purple color. Confused? I am. I don’t know if those southern counties are a mix of peanut and cotton farms (likely) or a mix of soybean and cotton farms (also likely).

Another problem with the additive colors is that the choice of each color has a major impact on the impressionistic take-away of the maps overall. Corn is the most prevalent crop in the US covering over 144,000 square miles. The next most prevalent crop is soybeans which covers about 100,000 square miles. Soy beans and corn are often grown in the same counties (unlike, say, wheat which is a hardier crop and therefore ends up as a monoculture in northern counties where growing corn and soy are riskier endeavors). This means that soy and corn are going to have layering colors the same way that we saw crops layering with cotton along the Mississippi River in the south. Since the bright red color for soy is more aggressive than the somewhat subdued dusty orange chosen for corn, the impression we take away from the map is that soy is more prevalent than corn where the opposite is true. If the color values had been switched so that corn was coded in bright red and soy was coded in the dusty orange, the middle section of the country would end up looking like a corn field, not a soy bean field. Either way, the trouble with blending colors is that our eyes are not very good at looking at a color and saying – “Gee, that looks like it’s about 50% blue and 50% red.” We just say, “Gee, that looks like purple”. Or, in this case, “Gee, all those reddish colors either look like soy beans or maybe an 80% coverage of the ‘fruit, nut, vegetable’ category.”

A solution (that I am too lazy to put together)

In summary, the inclination to display crop and livestock coverage using maps was a solid inclination. I often criticize the inappropriate use of maps. In this case, I still think it could have gone either way. A clever Venn-diagram that used circles based on the total coverage of each crop which then overlapped with other crops in places where they are grown together could have been more illustrative. It would have been easier to see that corn is king, for instance, and that cotton and wheat are never grown together because cotton needs heat and wheat is cold-tolerant. The same sort of Venn-diagram could have been constructed for livestock. A final Venn diagram where the size of the circles is keyed to the dollar-per-square mile value of these crops could have then displayed how agriculture functions economically.

References

Rankin, Bill. (2009) Food: Animal/Vegetable” [Information Graphic, Flash] RadicalCartography.net.

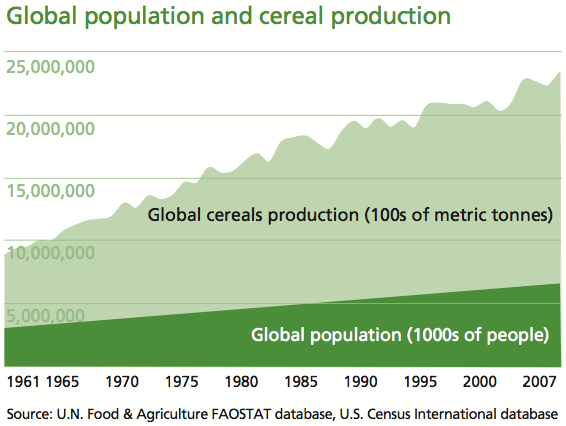
Global Population and Cereal Production
Global Population and Cereal Production - FAOSTAT database

What Works

The strength of this graph is its simplicity. It shows two trends at once – neither would be all that interesting without the other, but in concert, they tell us something. It’s a simple move that most social scientists ought to consider because it isn’t all that much harder than creating two individual graphs and displaying them side by side. This simple move, contextualizing global cereals production with the growth in the global population, clearly summarizes the issue addressed in the multi-thousand word essay. That message is, as I am sure you can guess from looking at the infographic above, is that population growth is not driving the growth in world hunger. The production of cereals is outpacing the growth in overall population.

For the sake of cross-media comparison, what would that infographic look like in words?

“Scarcity is a compelling, common-sense perspective that dominates both popular perceptions and public policy. But while food concerns may start with limited supply, there’s much more to world hunger than that.

A good deal of thinking and research in sociology, building off the ideas of Nobel laureate economist Amartya Sen, suggests that world hunger has less to do with the shortage of food than with a shortage of affordable or accessible food.” –Stephen Scanlan, J. Craig Jenkins, and Lindsey Peterson, Contexts Vol. 9:1; Winter 2010, p. 34-39.

What Needs Work

The article also ran with a graphic that shows the increase in the number of calories available per capita. Personally, I would have combined this data with the rise in global population because it is a more intuitive combination, even though the y axis would no longer be quite the same (one of them would be population in millions and the other would be calories in thousands – both are absolute scales so there would be a relatively easy work around that would allow the trend lines to be compared, which is what we are aiming for in the end). The original graphic looks at cereal production next to global population growth which invites questions about what portion of caloric intake comes from cereal, how sensitive cereals are to market fluctuations, and so forth like that.

References

Scanlan, Stephen; Jenkins, J. Craig; and Peterson, Lindsey. (Winter 2010) The Scarcity Fallacy in Contexts Vol. 9:1; p. 34-39.

FAOSTAT. Food and Agriculture Organization of the United Nations.
Note: I highly recommend FAOSTAT.

Michael Schwabs poster design for the Art Center College of Design in Pasadena, CA

How to go from inspiration to design?

There are plenty of great graphic designers plastering walls with posters, filling magazines with intelligent ads, and even getting their work into museums. A lot of the time, it’s hard to see how all the inspiration and excitement of graphic design for advertising can make it’s way into the information graphics social scientists use to communicate their findings.

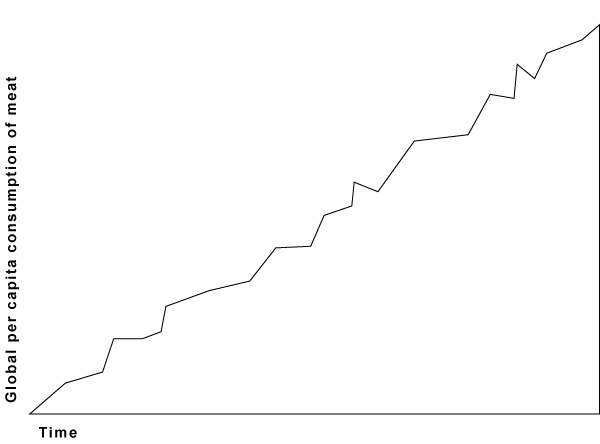
I took a fake example to show you how I translated my appreciation for Schwab’s design into some thoughts about enlivening a basic line graph. Let me emphasize this one more time: this example is fake. I didn’t use real data. Yes, global consumption of meat is increasing per capita, but no, it’s not as dramatic at it appears here. I went ahead and left off scales on the X and Y axes to ensure this graphic doesn’t end up traveling around the interwebs as truth.

Step 1

Break down Schwab’s graphic. He’s basically got a right triangle sitting on a single color background that bleeds into a thick border. The border contains the only text. The only realist element – the pencil – intersects the triangle to make what is like a giant X in the center of the poster.

How is this at all like social science graphics? Well, if you flip the triangle, it’s a lot like any positive relationship as depicted by a line graph.

Basic positive relationship depicted by a line graph

What next?

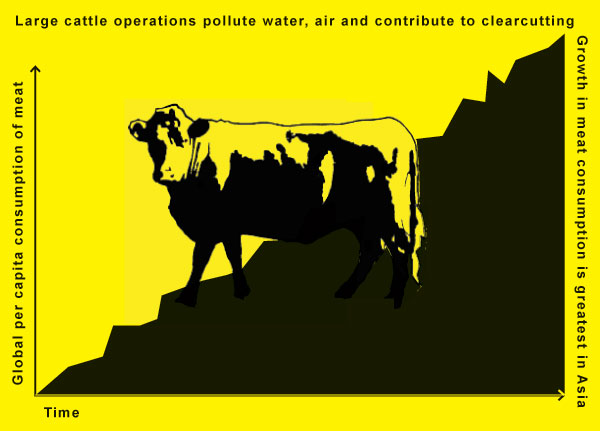
Now that you can see how a line graph is a little like Michael Schwab’s elegant pencil poster we can start to apply his decisions directly to our graphic. First, we can add a clearer background. If it’s just white the thick borders do not read as thick borders. They just look like the same old place everyone puts their axial labels. I distinguish this by adding a background color which will pull the borders into a relationship with the background behind the graph. I also go ahead and fill in the area under the graph to help nudge it into reading as an area, rather than some jiggly line.

The tough part here is the graphic. Not all stories we want to tell are going to be linked to a slender X-making image. I chose to depict the rise in meat consumption. Sure, I could have picked a cattle prod or other cattle killing tool dripping with blood. It would have been slender and I could have made an X. But I was trying not to appear unbiased so I just went with an iconic image of a beef cow. I planted the cow in the middle. We do lose a few data points in the middle – there are ways to deal with that if it’s important (overlay a yellow line across our cow’s gut where the data points are missing).

Here’s what we’ve got. The point is that the graphic below is the basically the same data as our line graph above except far more arresting (I took the liberty of adding two more lines of text – not necessary, but I was trying to closely follow Schwab’s concept). If you are trying to keep the attention of the audience in a presentation, be they sleepy students or sleepy colleagues, it might be worth your while to take a little extra time on your most important graphics. And if you do have one or two major points you want the people to take away from the graphic, you can write them across the top or up the side. Writing up the side is not as good – use it only for secondary points or graphic credits in the case that you hire someone to craft your graphics.

Simple line graph copying Michael Schwab's concept

References

Schwab, Michael. (2009) “Instrument of Creativity” [poster design] Art Center College of Design in Pasadena, CA.

Hirasuna, Delphine. (2009) “Art Center’s Instrument of Creativity” in At Issue Journal: The Online Journal of Business and Design. San Francisco, CA.

Water Resources and Withdrawals by Continent

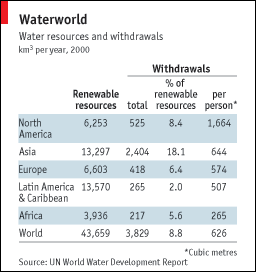
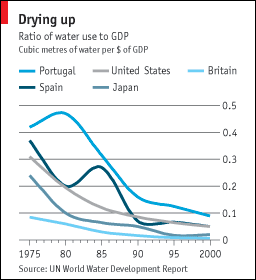
These graphics accompanied a great article about water shortages in episode of The Economist which arrived last week. The article was well written and comprehensive, handily summing up the way water resources are related to the growth of urban centers, climate change, the rising affluence of the world’s poorest people (and their conversion from vegetarianism to omnivorousness) and the question of whether or not fresh water is a global or a local problem. I highly recommend reading it. Unfortunately, I think you would do almost as well reading it without the accompanying graphics as with them.

The first one is so confusing I still don’t know what I am seeing here. Table data usually has the attribute that the longer you look at it, the more you get, with an occasionally painfully long initialization period in which you can’t make out any pattern whatsoever. I spent a good bit of time on this one and I still don’t know how to make sense of it. The article rightly points out that fresh water is unevenly distributed across the globe–some places have a lot, some places hardly have any. No big surprise. Also not surprising: some continents use more fresh water than others based on overall population size and agricultural production practices. So when I looked at this graphic, I was kind of hoping to get a sense of both how efficient each continent was with their resources and how dire their straits were. The graphic sort of does that. Sort of. We’ve got a measure of total renewable water resources but it doesn’t take into account total land area. It does take into account population, sort of, and maybe population is more relevant than total land area in this case.

Ratio of Water Use to GDP

The second graphic does not stand well on it’s own. I can see here that it appears that these selected countries seem to have been becoming more efficient with their water use. Since 1995, all of these countries have lowered the number of cubic metres of water used per dollar (or dollar equivalent) of GDP. This graphic does nothing on its own to help me understand why that might be true. Have these countries moved out of water intensive agricultural production? Have they made their agricultural production more efficient? If so, is it technological change leading to increased efficiency or did they just shift to more efficient crops? Or maybe the change is in the GDP variable, not the water variable. The graphic really just doesn’t clear any of these things up.

What Works

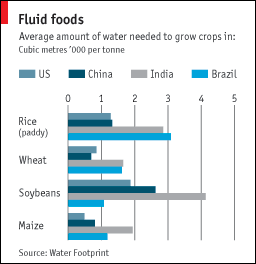
Water Used to Grow the Same Crop in Different Countries

I like the third graphic. It’s clear and adds to the text in the article. This isn’t the first time I have read about water shortages and one of the biggest and possibly easiest changes we could make to prevent the water shortage from becoming any more of a problem than it already is, would be to introduce drip irrigation in places that do not already have it. Yes, it costs some money. But it is far more cost effective than many of the other strategies introduced to combat climate change. Drip irrigation technology is not overly complex nor does it require extensive training or equipment to install. Tubing perforated along its length with small holes, buried under the surface of the earth, delivers water directly to plant roots. Much less water is lost to evaporation or seepage into non-crop areas. Control over water resources is better – during rains cisterns collect and store water for later distribution through the drip tubing during dry periods.

Relevant Resources

The Economist. (2009, 8 April) Water shortages go global: Sin aqua non. Istanbul.

Marijuana Arrests in New York City 1977 - 2006 (Harry G. Levine)

What Works

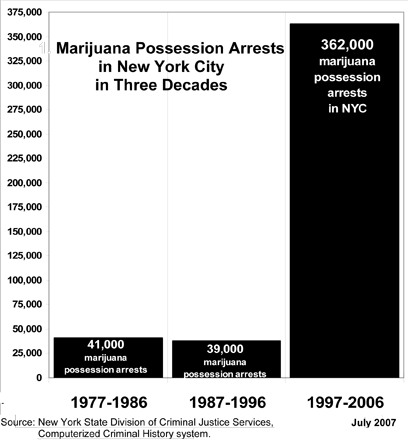
Sometimes simple is powerful. Everything here is well-labeled, the time periods move in even intervals and the source is cited. The point that arrests for marijuana possession have skyrocketed comes across almost instantly.

The graphic is taken from testimony given by Harry G. Levine, Professor of Sociology at Queens College and the CUNY-Grad Center to the New York State Assembly on Codes and Corrections:

“New York City has arrested about 100 mostly young people a day, every day, for the last ten years. By the end of today another 90 to 100 will be arrested. About 85% of the people arrested are Black or Latino, most are working class or poor, from the outer boroughs and from less affluent and poorer neighborhoods.”

Marijuana Arrests in New York 1987-2006 | Whites, Blacks, Hispanics

What Works

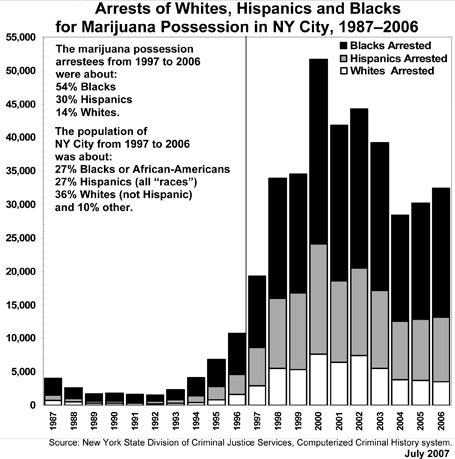
Levine includes this graphic in his testimony to demonstrate the uneven distribution of all these marijuana possession arrests across racial/ethnic boundaries. He is right to make sure to include a little decoder text about the distribution of whites, blacks, and hispanics as percentages of population of New York overall. Remember that in a world of equal arrest rates, whites would be arrested for possession roughly according to their percentage of the population, which is 36% in New York during the 1987-2006 period. But they were only accounted for 14% of the possession arrests. On the other hand, blacks should have been arrested 27% of the time but instead were arrested 54% of the time. Hispanics were the closest to even, representing 27% of the total population and 30% of the possession arrests.

What Needs Work

These stacked bar graphs always confuse people. So here we can use the y-axis to determine absolute number of arrests by racial/ethnic group but in other uses of this technique I’ve seen the bars all add to 100% and the viewer is supposed to suss out the relative proportion of the bar dedicated to the categorical break down. That clearly is not how this graph works, but still, where there is any chance of confusion, more work needs to be done to clear things up. I might have tried a hint of 3D, popping the white bar in front of the grey bar and the grey bar in front of the black bar just so that each bar reads as a distinct entity.

I would also have stuck the arrestee percentages directly next to the population percents. It would look more like:

Arrestees          Population
Blacks     54%     27%
Hispanics 30%     27%
Whites     14%     36%

Simple to do. Makes much more sense to read that data across rows. I would then have stuck the color shading key to the left of that little table and cut the “blacks arrested”, “whites arrested”, and “hispanics arrested” labels which would have cut down on the total amount of text the viewer would have to read through.

Go ahead and click through to the full report to see the other graphics and read the whole story about the astronomical increase in marijuana possession arrests in NYC with the disappointing follow-on that the arrests are being doled out in minority communities disproportionately more often than elsewhere in the city.

One parting quote to provoke you to jump across and read it all, in response to why there are so many arrests so unevenly distributed across the city’s population, “it is not because of any dramatic increase in marijuana use – which has not changed significantly since the early 1980s. Nor is the dramatic racial imbalance in the arrests the result of marijuana use patterns. In fact, marijuana use among Blacks and Hispanics is lower than for Whites, and has been for decades, as U.S. government statistics show. “

One More Thing

If you’re wondering where all the weed comes from, as I was, you might want to link through to the 2007 article “Home Grown” in The Economist via Proquest (subscription required) which notes in classically dry Economist fashion, “Marijuana is now by far California’s most valuable agricultural crop. Assuming, very optimistically, that the cops are finding every other plant, it is worth even more than the state’s famous wine industry.”

Relevant Resources

Becker, Howard. (1953) On Becoming a Marihuana User originally in American Journal of Sociology Vol. 59 November 1953 (235-242).

Dwyer, Jim. (30 April 2008) On Arrests, Demographics, and Marijuana The New York Times, NY/Region Section.

Levine, Harry G. (May 2007) Testimony before the New York State Assembly Committees on Codes and Assemblies.

Schlosser, Eric. (2003) Reefer Madness: Sex, Drugs and Cheap Labor in the American Black Market. First Mariner Books.

Home Grown: Cannabis in California (20 October 2007) in The Economist Vol. 385, Issue 8551 (60).

State of the World's Fisheries and Aquaculture - UNEP GRID-Arendal

What Works

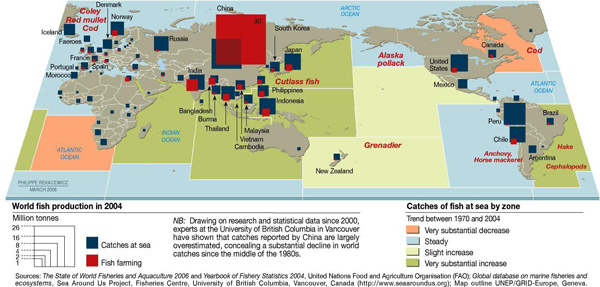
I couldn’t end the agriculture week without including a bit about the state of the oceans as a source of food. To be clear, agriculture is often related to farming the land and raising land-based livestock. Aquaculture is the term used to talk about fish farming. Catching fish out of the open water is not considered agriculture. I ought to have used the broader theme of food production.

I like this graphic because it’s got multiple levels of information – aquaculture vs. open water catches by volume, fish catch by country, and the status of the stocks by oceanic region. It can be difficult to figure out how to represent global level data when it isn’t possible to fall back on national boundaries. It’s a little odd to see the oceans chunked into squares, though.

What Needs Work

This graphic has a sort of not-quite-done look to it overall. The treatment of the aquaculture vs. open water catch could have been more elegantly integrated – superimposing the red and blue blocks on one another makes it look a little bit like the kids left their wooden blocks laying around on top of a map. I might have preferred pie charts with two pie pieces – one for the aquaculture bit and one for the open catch bit to communicate relative share. The size of the pies would be determined by absolute value of the total catch + aquaculture.

What I really would have liked to see would have been a more logical representation of the catch volume by oceanic region. The colors chosen don’t indicate much of anything, except perhaps the static areas which are just blue, standard ocean color. What would have been great would have been to indicate the relationship between areas that have decreased yields because they have been overfished and areas that are currently being overfished which will soon have decreased yields even though their current yields are high. This is complicated because the largest increase and the largest decrease are far more closely related to one another than they are to steady areas or areas with only a slight increase. It would be great if the ocean regions could be depicted by the replacement rate with an extra classification for areas that have been severely over-farmed to the point that the concept of replacement rate no longer has the same meaning.

Relevant Resources

United Nations Environment Programme – GRIDA (2009) State of the World’s Fisheries and Aquaculture

Public Service Announcement: The amount of mercury and arsenic found in predator fish is high enough that people who eat these fish recently can suffer the effects of heavy metal poisoning. To figure out what is safe to eat and what should be avoided, check out the Monterrey Aquarium, one of the best, if not *the* best source for guidelines about what to eat when what you’re eating lived in the water. They even have an iPhone app for easy reference at the grocery store and your favorite restaurants.

Monterrey Aquarium Seafood Watch

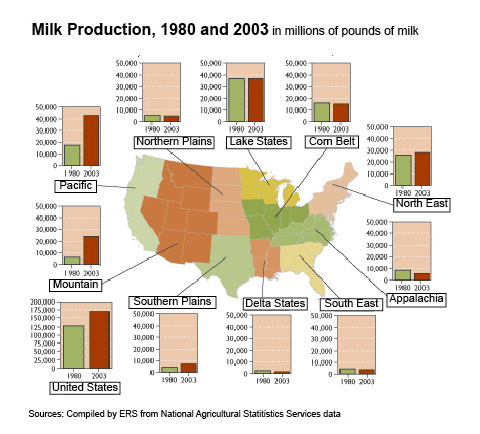
US Milk Production 1980 and 2003 by Region

What Works

The first map was produced by the USDAs Economic Research Service in 2004 to show the change in milk production by US region from 1980 – 2003. The accompanying text is surprisingly brief, “Since 1980, milk production in the U.S. has increased almost 33 percent. Regional production growth has been most pronounced in the Pacific and Mountain regions, the result of development of low-cost systems of milk production in the Pacific region and some Mountain States. Growth has been much slower in the Northeast and Southern Plains, and the other six regions have seen essentially flat or declining production.”

The graphic is a fairly straightforward way to combine a map with a bar graph. I like it better than if it were just a bar graph with regional labels, but I would like it even more if it were better integrated so that the data from the graphs were embedded in the map, maybe by showing the change in production by color or by applying concavity/convexity to the map.

What Needs Work

There is a serious drawback to the map + graph combination. One of the problem with images is that they tend to appear as sealed, complete narratives that are telling the whole story. It’s hard to interrogate an image, harder than interrogating a text. We’re taught not to believe everything we read, but those strategies don’t translate directly into the world of images. The important missing information here is that the population in the US is shifting to the south and west out of the north east. The image doesn’t suggest causal links; but the text does. However, it leaves out the no-brainer that since milk is a localized commodity, population growth is generally going to result in increased milk production in that area.

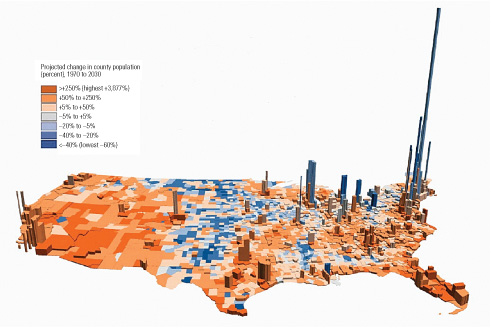
US Population Change, 1970-2030

Bonus Image

I found this image depicting population density and population change in the US. Cool colors indicate a loss of population; warm ones suggest growth. The z-axis represents human volume. A solid graphic. I have looked and looked and been unable to find the original source which just goes to show that once information hits the digital domain it really does have a life of its own. Hackers were right about that, information wants to be free.

Relevant Resources

Blayney, Donald. (2004) Milk production shifts West USDA Economic Research Center.

Dupuis, E. Melanie. (2002) Nature’s Perfect Food: How Milk Became America’s Drink. New York: NYU Press.

Mendelson, Anne. (2008) Milk: The Surprising Story of Milk Through the Ages. Knopf.

Figure 1 from "Diet, Energy, and Global Warming" by Eshel and Martin

US Greenhouse Gas Inventory Report - Executive Summary, Figure ES-11

Why This?

Continuing what I have decided will be an agriculture theme for the week, I went looking for data related to energy efficiency of diets. This concept first became news in the 1970’s during the energy crisis, championed in the book “Diet for a Small Planet” by Frances Moore Lappé which has recently been released as a 20th anniversary edition. I was interested in getting to the bottom of the planetary (rather than the personal) part of her argument which is that to produce unit weight of protein in the form of beef/veal, the animal is going to need an input equivalent to 21 units of protein and we’d be globally better off if we just ate the plant sources ourselves in terms of energy consumption and intelligent stewardship of the planet. I didn’t quite find what I was looking for to back up that data (yet) but I did find the contemporary twist on that argument which relates dietary choice to greenhouse gas emissions.

What Works

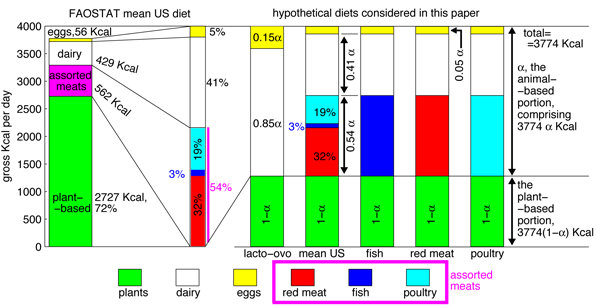
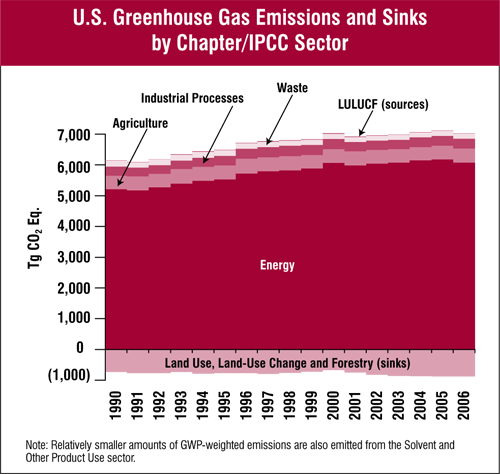
The first graphic doesn’t work all that well and probably makes no sense to you so we’ll come back to that. The second graphic, from the EPA, is not particularly pretty, but it has strength in simplicity and it makes intelligent use of the x-axis to represent greenhouse gas sinks. (Note: The visual representation does a great job of communicating that are emissions dwarf our sinks better than reading a number on a page would do.) Whereas the first graphic fails miserably to represent the difference in the energy efficiency of diets, the second graphic at least conveys the conclusion of the report that went along with the first graphic which is that the difference between eating the standard American diet and a vegan diet is, “far from trivial, …[it] amounts to over 6% of the total U.S. greenhouse gas emissions.”

The details of the report accompanying the first graphic are worth perusing and I only wish they would have spent more time trying to represent them graphically. The authors, Eshel and Martin, compute the comparative impacts of transit choice vs. dietary choice and find that, “while for personal transportation the average American uses 1.7 × 10⁷–6.8 × 10⁷ BTU yr−1, for food the average American uses roughly 4 × 10⁷ BTU yr−1.” That would make an excellent graphic in about ten different ways and catapult them past the problem that many readers are going to get tripped up looking at the orders of magnitude and units and miss the point.

What Needs Work

The first graphic is supposed to show the composition of the hypothetical diets considered. The mean American diet as reported by FAOSTAT has a little break-out component that provides more detail about the constituents of the animal products category but it took me a long hard look to figure that out. The break out part should have been constructed so it wasn’t exactly the same scale as the rest of the graphic (which it isn’t, by the way) otherwise it just reads like another column with viewers liable to assume that they can follow the scale on the y-axis. But the y-axis doesn’t relate to the break-out part at all – only the percentages listed alongside it are salient.

My bigger problem with the first graphic are the next five bars. Just to help you navigate α represents the proportion of the standard 3744 kcal diet that comes from animal sources. See α, think animal. A key would have been nice. Now that you know that, looking at the graph, it appears that each of the diets gets the same amount of kcals from plant sources because the green segments are all the same size. However, this is not actually what the authors are trying to convey. You have to read through the text quite carefully to pick out what proportion of each diet comes from animal sources overall. Once having done that, this graphic can help you further breakdown how those animal sources are apportioned. For example, the ovo-lacto group gets none of their animal protein from animal flesh – only from dairy (.85 of animal protein total) and eggs (.15 of animal protein total). But it took a good ten minutes of going between text and graphic to figure out what they have charted here. In all honesty, I’m still a little confused about whether the last three diets just switch out fish for meat for poultry and keep the same total number of kcalories in the animal flesh category relative to dairy+eggs. And I certainly can’t tell if any of those hypothetical diets have a greater or lesser proportion of kcals coming from plants by looking at this graphic.

In summary, the two graphics here were not trying to make the same point. The first one was trying to explain how the authors modeled their hypothetical diets in order to convince you that, in the end, and in conjunction with some other writing and graphic representation, if Americans moved to vegan diets the national greenhouse gas emission rate would drop by 6%, on par with what would happen if everyone started driving a Prius. The second graphic does this much better using aggregate data (and thus a totally different approach than Eshel and Martin).

Relevant Resources

Eshel, Gidon and Martin, Pamela. (May 2005) Diet, Energy and Global Warming. Submitted to Earth Interactions.

United States Environmental Protection Agency. (April 2008) Inventory of U.S. Greenhouse Gas Emissions and Sinks: 1990-2006

Moore Lappé, Frances. (1971, 1991) Diet for a Small Planet Ballantine Books.