
Why This?
Continuing what I have decided will be an agriculture theme for the week, I went looking for data related to energy efficiency of diets. This concept first became news in the 1970’s during the energy crisis, championed in the book “Diet for a Small Planet” by Frances Moore Lappé which has recently been released as a 20th anniversary edition. I was interested in getting to the bottom of the planetary (rather than the personal) part of her argument which is that to produce unit weight of protein in the form of beef/veal, the animal is going to need an input equivalent to 21 units of protein and we’d be globally better off if we just ate the plant sources ourselves in terms of energy consumption and intelligent stewardship of the planet. I didn’t quite find what I was looking for to back up that data (yet) but I did find the contemporary twist on that argument which relates dietary choice to greenhouse gas emissions.
What Works
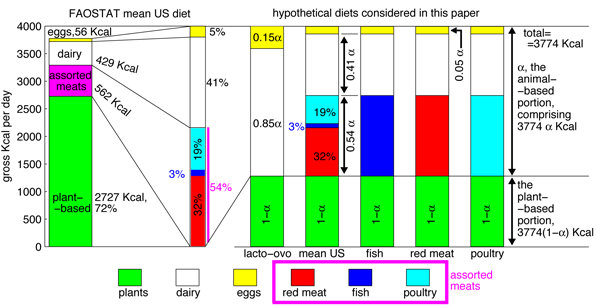
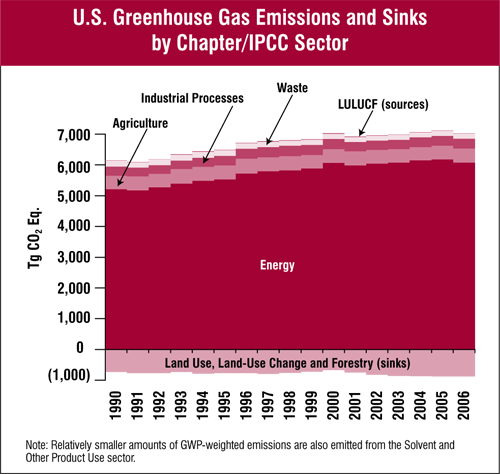
The first graphic doesn’t work all that well and probably makes no sense to you so we’ll come back to that. The second graphic, from the EPA, is not particularly pretty, but it has strength in simplicity and it makes intelligent use of the x-axis to represent greenhouse gas sinks. (Note: The visual representation does a great job of communicating that are emissions dwarf our sinks better than reading a number on a page would do.) Whereas the first graphic fails miserably to represent the difference in the energy efficiency of diets, the second graphic at least conveys the conclusion of the report that went along with the first graphic which is that the difference between eating the standard American diet and a vegan diet is, “far from trivial, …[it] amounts to over 6% of the total U.S. greenhouse gas emissions.”
The details of the report accompanying the first graphic are worth perusing and I only wish they would have spent more time trying to represent them graphically. The authors, Eshel and Martin, compute the comparative impacts of transit choice vs. dietary choice and find that, “while for personal transportation the average American uses 1.7 × 10⁷–6.8 × 10⁷ BTU yr−1, for food the average American uses roughly 4 × 10⁷ BTU yr−1.” That would make an excellent graphic in about ten different ways and catapult them past the problem that many readers are going to get tripped up looking at the orders of magnitude and units and miss the point.
What Needs Work
The first graphic is supposed to show the composition of the hypothetical diets considered. The mean American diet as reported by FAOSTAT has a little break-out component that provides more detail about the constituents of the animal products category but it took me a long hard look to figure that out. The break out part should have been constructed so it wasn’t exactly the same scale as the rest of the graphic (which it isn’t, by the way) otherwise it just reads like another column with viewers liable to assume that they can follow the scale on the y-axis. But the y-axis doesn’t relate to the break-out part at all – only the percentages listed alongside it are salient.
My bigger problem with the first graphic are the next five bars. Just to help you navigate α represents the proportion of the standard 3744 kcal diet that comes from animal sources. See α, think animal. A key would have been nice. Now that you know that, looking at the graph, it appears that each of the diets gets the same amount of kcals from plant sources because the green segments are all the same size. However, this is not actually what the authors are trying to convey. You have to read through the text quite carefully to pick out what proportion of each diet comes from animal sources overall. Once having done that, this graphic can help you further breakdown how those animal sources are apportioned. For example, the ovo-lacto group gets none of their animal protein from animal flesh – only from dairy (.85 of animal protein total) and eggs (.15 of animal protein total). But it took a good ten minutes of going between text and graphic to figure out what they have charted here. In all honesty, I’m still a little confused about whether the last three diets just switch out fish for meat for poultry and keep the same total number of kcalories in the animal flesh category relative to dairy+eggs. And I certainly can’t tell if any of those hypothetical diets have a greater or lesser proportion of kcals coming from plants by looking at this graphic.
In summary, the two graphics here were not trying to make the same point. The first one was trying to explain how the authors modeled their hypothetical diets in order to convince you that, in the end, and in conjunction with some other writing and graphic representation, if Americans moved to vegan diets the national greenhouse gas emission rate would drop by 6%, on par with what would happen if everyone started driving a Prius. The second graphic does this much better using aggregate data (and thus a totally different approach than Eshel and Martin).
Relevant Resources
Eshel, Gidon and Martin, Pamela. (May 2005) Diet, Energy and Global Warming. Submitted to Earth Interactions.
United States Environmental Protection Agency. (April 2008) Inventory of U.S. Greenhouse Gas Emissions and Sinks: 1990-2006
Moore Lappé, Frances. (1971, 1991) Diet for a Small Planet Ballantine Books.
