drugs

New Drug Wave Takes Toll | Star Tribune "A Lethal Dose" series

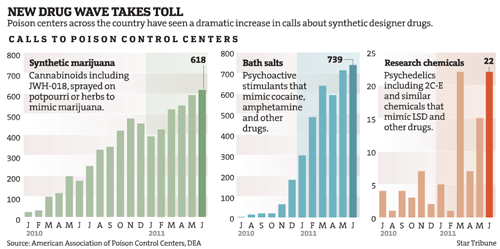
This graphic was subset from a larger graphic. I trimmed off the third drug comparison because it was problematic for reasons I explain below.
New Drug Wave Takes Toll | Star Tribune "A Lethal Dose" series

What works

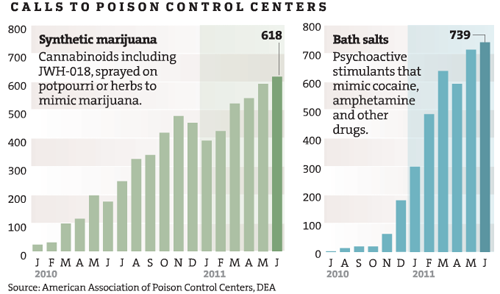
Tracking illegal behaviors can be extremely difficult because the people participating do not want to be arrested or fined. How then, do health investigators find out what risky behaviors people are doing in their leisure time? In this case, the investigative team on the Lethal Dose series at the Minneapolis – St. Paul Star Tribune newspaper used calls to the poison control center as a proxy for tracking the rise of newly available synthetic drugs. As journalists rather than, say, doctors, they do not have access to patient data. Using poison control center calls is not a perfect indicator of the spread of the new synthetic drugs, but they have followed up these charts with an entire series in which they interview parents and friends of victims as well as a retailer more than willing to defend his right to sell.

What works for me about this graphic is that the investigators found a fairly unbiased source of information about this drug use, something that helps tie the other articles in the series together. Interviewing stubborn retailers and grieving friends and family is part of what journalists do, but those interviews are so emotionally and politically charged that it I appreciate the presence of trend information.

Because these drugs are new, it was necessary to spell out active ingredients because the average person will not know. I appreciate that they included that in the graphic rather than in a footnote.

What needs work

The shading behind the bar graphs is frivolous. It adds no information and is not necessary to guide the eye. It could be dropped and nothing would be lost.

Trend data is better as a line graph than a bar graph because it is easier for the eye to follow a line and to compare one line to another line than to follow a series of steps and compare one series of steps to another.

This blog post focuses on two drugs that use the same axis. I would have kept the same axis for the third drug even though it’s use numbers are lower. Note that all of the drugs started with low numbers and rapidly climbed – perhaps the third drug family “synthetic chemicals” is simply lagging behind by a year or so. It is hard to make that comparison when the axis is so dramatically different from the other two. There is a danger in lying with graphics here – making the third graph seem comparable to the first two implies that the third drug poses an equal threat. The numbers do not support that assumption.

References

Star Tribune staff writers. (2011) A Lethal Dose: The war on synthetic drugs Investigative reporting series.

Star Tribune. (2011) “New Drug Wave Takes Toll” [Information Graphic] American Association of Poison Control Centers, DEA.

Drug Cartel Areas in Mexico | Christian Science Monitor

Drug cartels cause social ills

Unless you’ve had your head in a bucket since 2007, you are at least vaguely aware that Mexican drug cartels trafficking their goods into the US have caused significant social illness in Mexico, especially in areas close to the US border. Social illness here can be measured in cartel-driven murders, but that captures only the most gruesome, sensational branches of the drug virus. Besides the deaths are fear, anxiety, mistrustfulness as well as poverty, corruption, and vast inequality.

Is mapping the right way to understand Mexico’s drug trafficking problem?

The graphics here try to pack all of the complexity and destruction of those social ills into maps. Maps are rational. They allow us to feel we have a handle on the components that make up a problem. In this case, I am sure they are not explaining the whole story. I’m also not sure they are trying to explain the whole story.

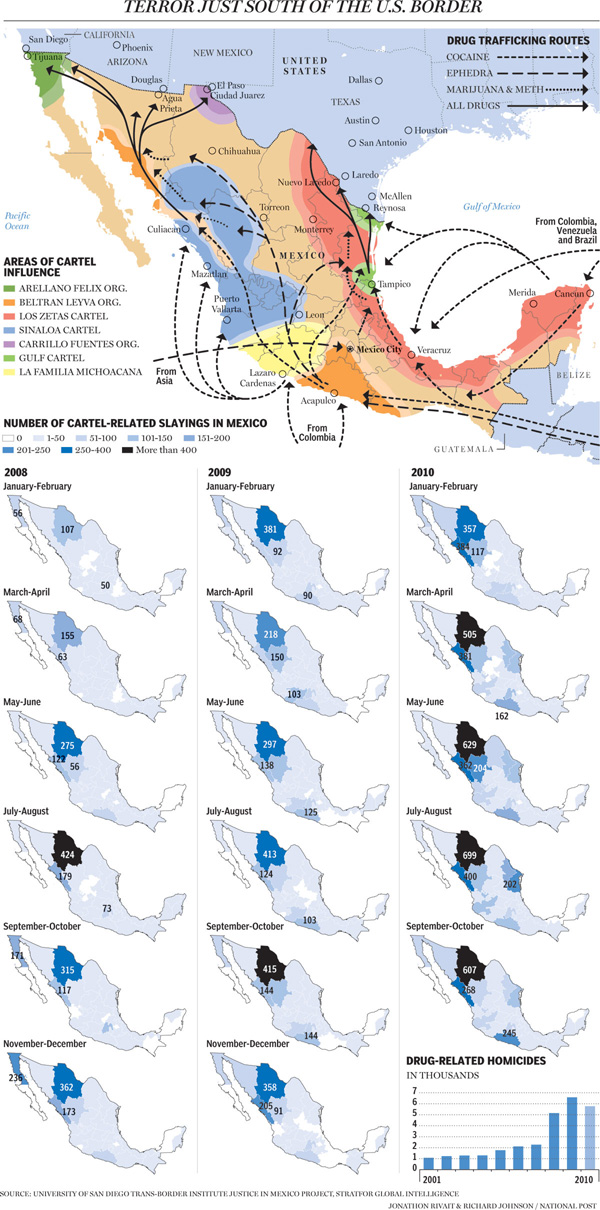
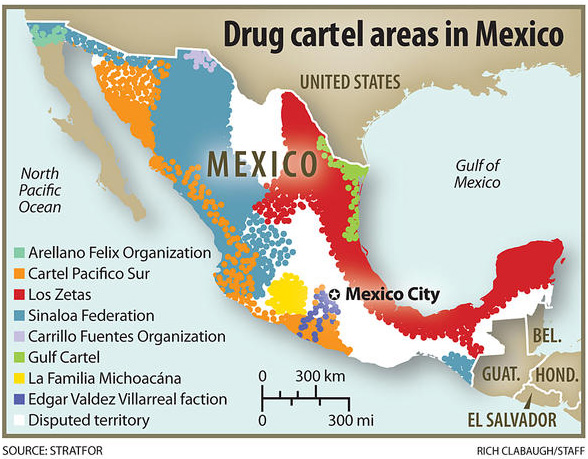
What I like about the first map is that the map makers lay out the obvious: which cartels are where. Then they go one step further and highlight the contested territory. In case the colors aren’t coming through clearly, the white areas are the disputed areas. There are a lot of white areas.

And yet…

One would expect most of the violence in a situation like this to be in the disputed areas. But that isn’t the case. Most of the violence is near the US border. The border is another kind of contested territory, one that is much more important than white areas as far as violence prevention is concerned. In fact, those areas aren’t governed by one cartel or another because those areas are not critically important to drug trafficking. None of the cartels much care.

So let’s take a look at another map because I’m thinking the first one implies that we should find violence in the middle of the country.

Drugs and deaths in Mexico

Drug-related crimes south of the US border | The National Post

This graphic shows not only traffic patterns – where do the drugs go? – but also maps of where the deaths have been. It quickly becomes clear that the drug-related deaths are up near the US border, not in the ‘disputed areas’ highlighted in the previous map. In this map, (thanks unnamed National Post graphic designer) that undisputed area is left unclaimed and unlabeled. That’s a more accurate way to understand those regions and the inset series of maps below the main map do a good job of visually locating cartel-related violence.

The other thing I love about this map is that it specifies *which* drugs are being trafficked. Call me crazy, but I have found it odd that there is a great deal of talk about ‘drugs’ in Mexico as if there is no good reason to talk about which drugs are being moved where. Why is it useful to know which drugs are going where? First, it’s nice to know which drugs because different drugs have different price points per volume and weight. Economics matter. If one drug has a higher profit margin than another because it retails for more per ounce but doesn’t cost much more to produce/transport, one could assume that it will become more popular. Then again, demand matters, too. Even if pot is easy to produce, doesn’t mean you can convince cocaine users to try weed. They probably already tried it and moved on.

Another reason it matters which drugs we’re talking about is that detection and apprehension vary from drug to drug. An easy example: a pot sniffing dog probably won’t lead authorities to a stash of ephedra. What’s more, being able to tell where things are coming from and going to means that it is easier for authorities to target weak points in the routes. We know from news stories (I recommend looking at the LATimes, see references below), we know that drug runners pour much energy into protecting the drug routes right at the US border. But they aren’t digging tunnels under all of Mexico. There are points in the chain of drug traffic that are more vulnerable. Some of those points are deep within Mexico where it might be difficult to get well-trained, cooperative authorities with the necessary tools and manpower to perform raids.

My main gripe about these graphics is that they display this problem as a Mexican problem. This is not a Mexican problem. It is a Mexico-US problem. The demand in the US is pulling all those drugs up from south of the border. Looking at it this way helps introduce conversations about economic imbalances. I imagine that one of the reasons drugs come from Mexico is the same reason that many large companies choose not to have large labor forces in the US: labor is cheaper in Mexico. Various instantiations of poverty also tend to encourage corruption; encouraging local police to fight the cartels is hard when they are out-gunned and out-manned by cartels who can afford to pay off whoever they want including witnesses, other cops, border agents, and whoever else is likely to become cooperative after the application of a bit of grease.

Conclusion

The drug-related social illness in Mexico is an unfolding problem, one that has been discussed with more complexity elsewhere. I hope to illustrate that while the rationality of mapping patterns is appealing, it also tends to obscure complexity. It’s easier to misinform than inform with a map. They are deceivingly neat, these maps.

References

LATimes “Mexico Under Siege” special section, US News.

Llana, Sara Miller. (13 January 2011) “Mexico drug war death toll up 60 percent in 2010. Why?” in The Christian Science Monitor, World/Americas section.

National Post Staff. (31 December 2010) Graphic: Drug Terror Just South of the Mexico Border in The National Post. [Graphic].

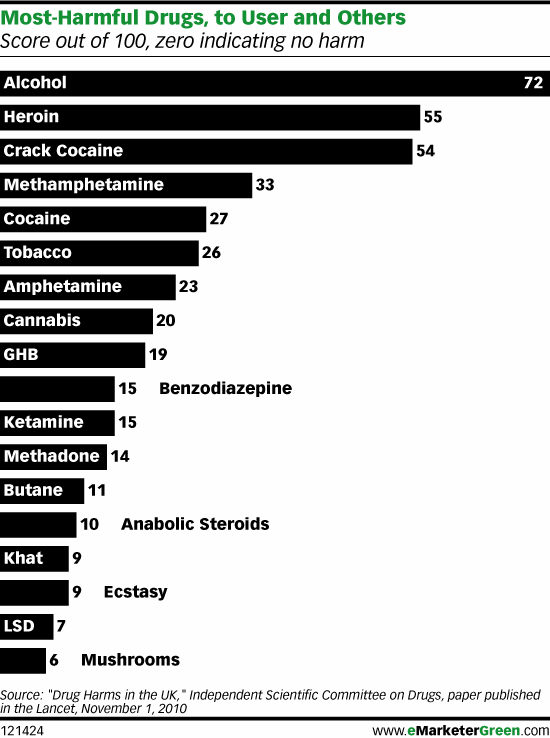
Original Version of the bar graph

How is the scoring system determined?

British researchers affiliated with the Independent Scientific Committee on Drugs met for a one day workshop and constructed a composite scoring system to determine which drugs are most harmful both to individuals and to society collectively. Scores can range from 0 – 100. Authors David Nutt, Leslie King and Lawrence Phillips found that,

heroin, crack cocaine, and metamfetamine were the most harmful drugs to individuals (part scores 34, 37, and 32, respectively), whereas alcohol, heroin, and crack cocaine were the most harmful to others (46, 21, and 17, respectively). Overall, alcohol was the most harmful drug (overall harm score 72), with heroin (55) and crack cocaine (54) in second and third places.

The full list of factors that were included in the composite score are here:

  • Mortality
  • Damage
  • Dependence
  • Impairment of mental functioning
  • Loss of tangibles
  • Loss of relationships
  • Injuries to others
  • Crime increase
  • Environmental degradation
  • Family breakdowns
  • International turmoil
  • Economic cost
  • Loss of community cohesion and reputation

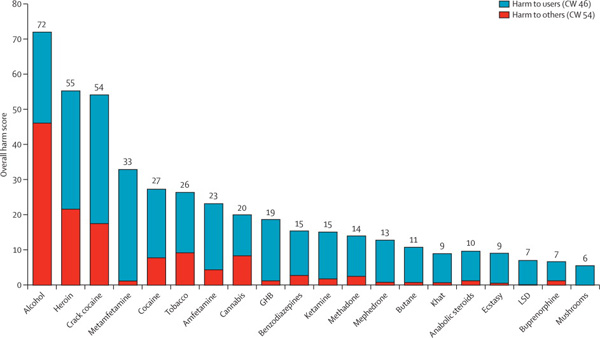
Though it is possible to go into an explanation of how each of these was measured and subsequently combined to produce the composite scores, I am going to leave that discussion to the authors of the original study. There’s an overview graph below and the full article Drug Harms in the UK: A multi-criteria decision analysis is at the Lancet.

Composite scores showing contributions from harm to individuals and harm to society

What can be done?

I found it interesting that there was no attempt made to distinguish between legal and illegal drugs. Yes, of course, some drugs are not clearly legal or illegal. They are legal when prescribed and supervised by a doctor but illegal when used off-label or outside the medical authority system (like anabolic steroids, methadone, and marijuana in California). I assumed that most methadone users are under some kind of supervision but that most anabolic steroid users are using the steroids off-label (ie illegally). You can quibble with my choices below. The point here is that I found the graph to have more context if the legality issue was visually inscribed into it.

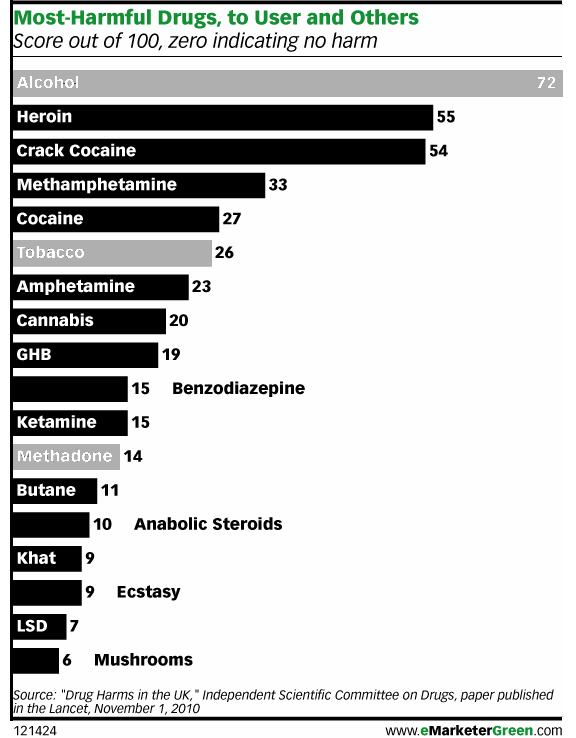
Photoshopped version of graph that highlights legal drugs

There are age limits and places where it’s illegal to smoke or drink, but for the most part everyone will be able to use alcohol and tobacco legally for most of their lives. Methadone is probably being used legally in most cases. That’s why I shaded those bars grey. I am not expert on methadone, but I see that it is much less harmful to users and to society than heroin, the drug it stands in for, so I guess if this were the only data I had to make a decision about continuing methadone treatment programs, I would keep them going. I would also call for close scrutiny of methadone programs. Something is clearly not working as well as it could be.

As for alcohol and tobacco…well…it’s hard to argue *for* the continuing legality of alcohol. How large do detriments to society have to be to trigger additional control mechanisms? The authors of the study noted that alcohol is part of society and it isn’t going anywhere. I agree. Prohibition was a failed experiment in this country and I’m not suggested we try it again. However, I would like to reopen the debate about how the negative impacts of alcohol can be alleviated. I recommend that all new cars must have breathalyzers in them. If the driver cannot blow a legal sample, the car won’t start. Yes, people could game that system by having their friends blow for them, but often one’s friends are also drunk. And hopefully, friends really wouldn’t let their friends drive drunk. Once upon a time, seatbelts were considered extraneous and seatbelt laws were considered constraints upon American’s rights to freedom and the pursuit of happiness. Well, when a drunk driver kills one of your family members, you might decide that the sudden loss of your mother or son or niece puts a much bigger crimp in your pursuit of happiness than a breathalyzer in your car ever would have. Will breathalyzers make cars cost more? Probably. But the cost of dealing with car accidents caused by drunken driving, even when they aren’t fatal, is absorbed by random individuals who happened to be in the wrong place/time as well as tax payers who pay to repair guard rails, subsidize public hospitals and EMTs, pay cops’ salaries, and so on.

References

Nutt, David J, Leslie A King, and Lawrence D Phillips. (6 November 2010) “Drug harms in the UK: a multicriteria decision analysis” The Lancet, Vol 376(9752): 1558 – 1565.

Xanax Nation | GOOD Mag. Transparency Blog

What works

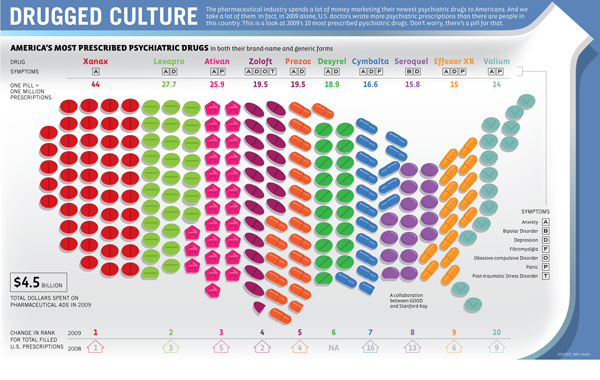
Um, so, I’m trying to think of what is working here. I guess we see that there are about 10 psychiatric drugs, that lots of people appear to be receiving treatment for anxiety (heck, two wars, an economic crisis, trapped Chilean miners, BP’s oil spill…all this anxiety makes sense to me). We are meant to believe that this represents a huge and possibly stifling example of big pharma. But really, this graphic doesn’t say that to me. It says “lots of people are anxious and choosing to take prescription drugs to cope”.

Xanax Nation without the map

What needs work

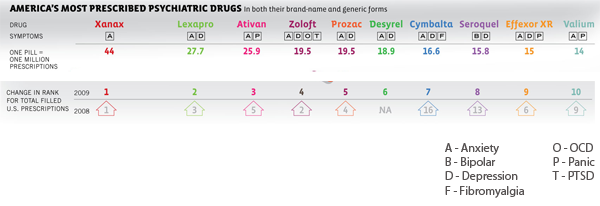
Just for some crazy antic fun, infographic style, I whipped out my digital crop tool and got rid of the map just to see what we would lose. Clearly, we lose some fun. Almost all the pretty colors are gone. But the information? It’s all still there. The map was being used as a giant and rather useless crutch in this case. This is a particularly egregious case, but there are many instances of maps that don’t encode any information that is useful for the debate of the topic at hand. Ask yourself: what did the map do? Was there any variation contained in the map? Was the dataset in question geographically oriented in any way? No. No, it was not.

Thanks to Austin Haney, Sociology grad student at Kent State for sending this our way.

References

Drugged Culture GOOD magazine, Transparency Blog.

(2010) One Nation Under Xanax in Psychiatric Times.

Same Sex Encounters Between Men | OKCupid Blog
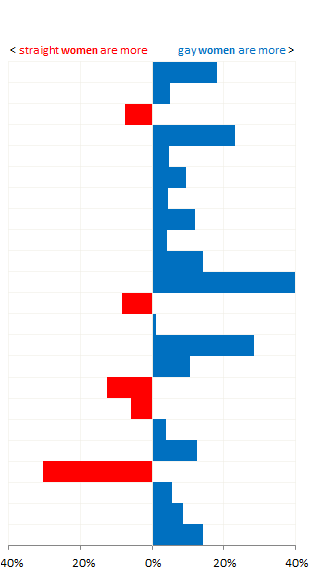
Same Sex Encounters between Women | OKCupid Blog

What Works

I have been posting about marriage lately and I thought I would take a break from that, but stick with the relationship topic. If you haven’t discovered the blog at OKCupid, I highly recommend heading over. With a strong mathematical background, the folks at OKCupid are thrilled to take their users’ likes, dislikes, and reported behaviors, run the stats, and provide us with the infographics. I promise it will be worth your while to head over…later on in the post where I located the pie charts above, there is a quote which I am reposting here because I thought it was the most hilarious reference to Karl Marx that I’ve encountered in a very long time:

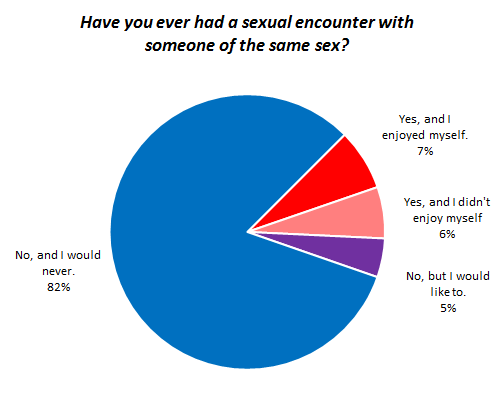
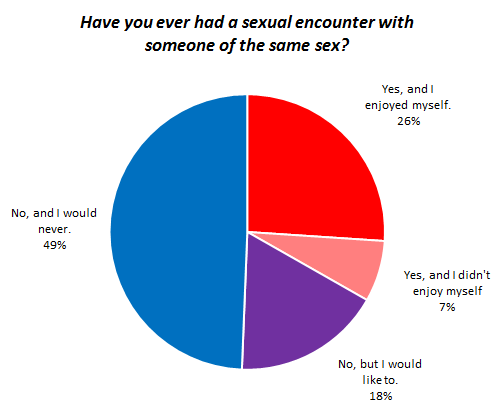
According to Verta Taylor and Leila Rupp, who wrote a piece for Contexts called “Straight Girls Kissing”, homosexual experimentation in the US is possible for women in a way that it is not for men. At first glance, much of the ‘straight girls kissing’ going on at bars and fraternity parties appears to be a rather perverse appropriation of female sexuality for the visual pleasure of men. The history of the male gaze is so entrenched here that anything sexual going on with women is assumed to be for men, even when the sexual behavior is homosexual – especially if it is done in public as spectacle. [Note: If the girls kissing get so into it that they appear to be ignoring the male attention altogether, they do risk social sanctioning laced with homophobic slurs. So straight girls kissing better make sure they maintain some kind of connection to heteronormative behavior or they could, I don’t know, have beer poured all over them. See Rupp and Taylor.] What this means is that women who have experience with other women do not necessarily fall outside of the category ‘heterosexual’ which for many women, makes the experimentation seem quite a bit safer than if they felt that any homoerotic behavior would automatically queer their social sexuality. The same is not true for men.

Rupp and Taylor found that ‘straight girls kissing’ is not just another example of girls gone wild trying to get male’s attention by flaunting ‘extreme’ sexuality. In interviews, many of the women involved reported that at least some of the instances of their public encounters with other women opened up the possibility for them to explore their self-generated (rather than crowd-generate) attractions to other women. OKCupid’s report indicates that having this culturally condoned space to get out there and try kissing girls without risking the stigma of being labeled lesbian allows a fair number of women to have enjoyable encounters with other women. What’s more, a fair proportion of the women who haven’t done it feel like they are missing out.

If our heteronormative culture could relax the rigid classification of male sexuality to afford the same kind of bi-curious space for men, maybe they would feel more free to experiment with other men and enjoy themselves.

What needs work

I hate pie charts. I would have rather seen this one as a set of bar graphs – the ‘tried it and liked it’ in the same color as the ‘haven’t tried it but want to do it’. Then the ‘never, and don’t want to’ can be lumped with the ‘tried it and didn’t like it’. Though I do wonder if the ‘tried it and didn’t like it’ might have been specific to the person they were trying it with on that occasion. It would be useful to know if those people would try it again.

Humor

I found the quote below so funny that I laughed out loud in the class where I was supposed to be serving as a TA rather than as an internet surfer. The class is taught by Paula England about Sex and Love in Modern Society, so looking at OKCupid’s blog was right on topic, but still. Laughing in class distracts the students.

“Religion is the opiate of the masses, so long as the masses are straight. However, amass a bunch of lesbians and you’re going to need actual drugs.”

Women's Personality Traits by Sexual Orientation | OKCupid Blog


Before anyone gets angry and posts to my blog, take a deep breath. Is it possible that straight people are claiming to be lesbians and then reporting drug use just to make lesbians look drugged out on OKCupid? Yes. But that’s a stretch. Is it possible that lesbians feel pressure to report being adventurous, thereby indicating an openness to drug use, if not actual use? Yes, it’s possible that they are reporting more drugs than they’re actually using or that they are the only honest people on OKCupid and all the straight people and gay men are under-reporting drug use. My point is that twisting Marx around like that was sociology nerd humor at it’s best.

OKCupid’s numbers come from 3.2 million dating profiles. Dating profiles may not be the place you’ll find soul-searching truths. However, what we do find are the embellishments people adopt to make their actual selves slouch closer to their ideal selves so as to attract their ideal mates.

References

Rupp, Leila and Taylor, Verta. (Summer 2010) Straight Girls Kissing Contexts Magazine.

Rudder, Christian. (12 October 2010) Gay vs. Straight Sex. OKCupid Blog.

Getting drugs to market faster, timeline graphic | Wired Magazine May 2010
Getting drugs to market faster | Wired Magazine May 2010

What works

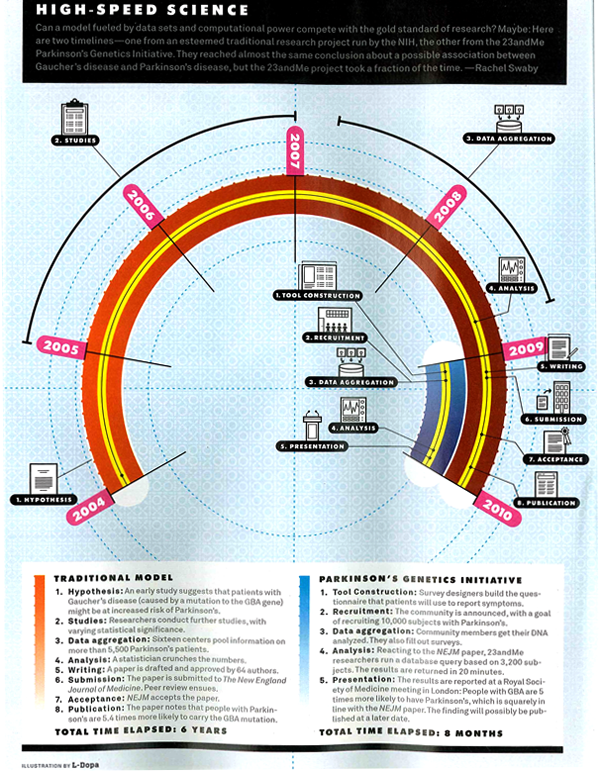
I am not a huge fan of this graphic though I admit it works better in print than it does in this crappy scan of the print article. My apologies. Click through here for a crisp version.

In summary, the article is about the way that research is done in the presence of many more data points (specifically, complete DNA maps of numerous individuals) and much more processing capacity. They argue using a case study revolving around the personal story of Sergey Brin who is at risk of developing the as-yet-untreatable Parkison’s disease, that data mining means research will progress much faster with no loss of accuracy over traditional research methods. They use a medical research case so they get to conclude that moving to data mining will mean people who might have died waiting around for some peer review committee (or other tedious component of double-blind research methodology) will live. Hallelujah for data mining!

They summarize their happiness in this Punky Brewster of a timeline.

What needs work

First, why did the art director order a timeline and not a diagram about how the assumptions underlying the research method have changed? It is clear that the article is taking a stand that the new research methods are better because they are faster and, in the case of Parkinson’s, could save lives by speeding things up. That is undoubtedly true, as it would be for any disease for which we currently don’t have anything that could be referred to as a “cure”. However, as a skeptical sort of reader, I find it difficult to simply believe that the new data-mining variety research is always going to come up with such a similar result – “people with Parkinson’s are 5.4 times more likely to carry the GBA mutation” (hypothesis driven method) vs. “people with Parkinson’s are 5 times more likely to carry the GBA mutation” (data-mining method). If the article is about research methods, which is ostensibly what it claims. However, featuring the chosen cause of e-world celebrity Sergey Brin could indicate that Wired doesn’t so much care about changing research methods as it cares about selling magazines via celeb power. Fair enough. It’s kind of like when Newsweek runs a cover story about AIDS in Africa accompanied by a picture of Angelina Jolie cradling a thin African child. Are we talking about the issue or the celebrity? In this particular article, it seems to me that if the core message were to focus appropriately on the method, the graphic could have depicted all of the costs and benefits of each research model. The traditional model is slower but it makes more conservative assumptions and subjects all findings to a great deal of peer review which offers fairly robust protection against fallacies of type 1 and type 2 (ie it protects us from rejecting a true hypothesis as false and accepting a false hypothesis as true). In the data mining scenario, since the process begins not with a hypothesis but with the design of a tool, there are reasons to believe that we may be more likely to run into trouble by designing tools that too narrowly define the problem. A graphic describing just how these tools are constructed and where the analogous checks and balances come in – where are the peer reviewers? What is the hypothesis? How do data-miners, who start by developing tools to extract data rather than hypotheses in line with the current literature, make sure they aren’t prematurely narrowing their vision so much that they only end up collecting context-free data (which is basically useless in my opinion)?

Don’t get me wrong, I am excited by the vast quantities of data that are both available and easy to analyze on desk top computers (even more can be done on big work stations and so forth). Caution is in order lest we throw out all that is reliable and robust about current research methods in favor of getting to a result more quickly. We could use the traditional hypothesis driven, double-blind kind of trial procedure coupled with the power of DNA analysis and greater processing capacity. It’s somewhat unclear why we would abandon the elements of the traditional scientific method that have served us well. There is a way to integrate the advances in technology to smooth over some of our stumbling blocks from the past without reinventing the wheel.

Concerns about the graphic

My second major problem is that this graphic is one of a type commonly referred to as a ‘time line’. In this case, what we appear to have is a time line warped by a psychedelic drug. This might, in fact, be appropriate give that the article is about neurology and neuropathy. Yet, the darn thing is much harder to read in the Rainbow Brite configuration than it would be if it were, well, a line. Time. Line. And the loop back factor implies that there is going to be a repetition of the research cycle starting with the same question (or dataset) all over again. That’s sort of true – the research cycle has a repetitive quality – but it is not strictly true because hopefully the researchers will have learned enough not to ask the exact same question, following the exact same path all over again.

References

Goetz, Thomas. (July 2010) Sergey’s Story Wired Magazine.

Wired magazine. (12 March 2009) Science as Search: Sergey Brin to Fund Parkinson’s Study on the Wired Science blog.

23andme (11 March 2009) A New Approach to Research: The 23andMe Parkinson’s Disease Initiative. [This was an early announcement about this project from 23andme who offered the DNA analysis].

Alcohol Statistics, England | from The Missing Graph

What works

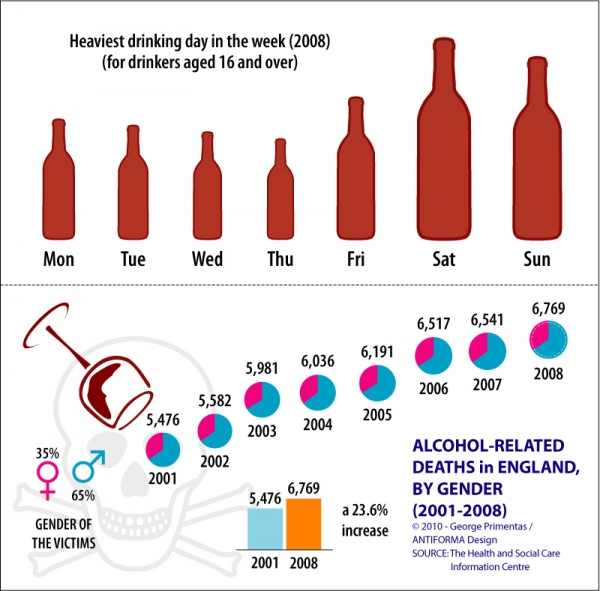
Leading up to the World Cup I am going to try to focus on World Cup related issues. It isn’t that much of a stretch to think about the relationship between sport and the larger category recreation, which often includes drinking. I found this graphic at The Missing Graph by Antiforma Design. The point here was to look at drinking in England – when is it happening? who is doing it? and who is dying? As you can see, men drink more and die more from drinking. Most drinking happens on the weekend and on holidays (there are more Monday and Friday holidays than other weekday holidays in England). Most alarming is that drinking deaths are increasing, not decreasing. Hard to blame it on the recession since the collection period ended in 2008 and increased the most rapidly from 2005 to 2006, a period of relative prosperity and optimism.

What needs work

I would have loved to see a couple more points of information about drinking in England. First, I assume that the information that generated the size of the bottles for each drinking day was somehow related to gallons consumed. I want to know those gallon figures per capita. Then we would be able to compare England’s data to some other country’s data, assuming we ever had a similar set of information about some other country (like, say, South Africa).

I would also have liked some information on what it is that these folks are drinking. Wine? Whiskey? Beer? Absinthe? Something from the bathtub? Perhaps the drinking culture of the country supports more beer drinking but the death-drinkers are drinking something else. Or maybe they just drink too much of the standard fare. Again, since I’m thinking about cross-national comparisons, I’m interested in things that might contribute to a deadly or less deadly drinking culture.

One other consideration: a friend of mine has long been interested in the relationship between drinking and HIV transmission. You’d think someone would have done extensive research on this because it’s rather obvious – drunk folks may have less in the way of cognition and patience when it comes to reaching for a condom. But it has not been well explored. Out of that existing curiousity of mine, I wouldn’t have minded seeing some trend lines for HIV transmission, serious auto accidents, and other sorts of ill-planned behavior that we might associate with drunkenness.

Overall, I love the notion that there is a blog out there dedicated to making infographics out of an intrinsic interest in presenting information for public consumption.

Reference

Primentas, George. (May 28, 2010) “Alcohol-related deaths in England” at The Missing Graph.

War on Drugs in Mexico (Civil war - Mexican cartels versus Mexicans)

What works

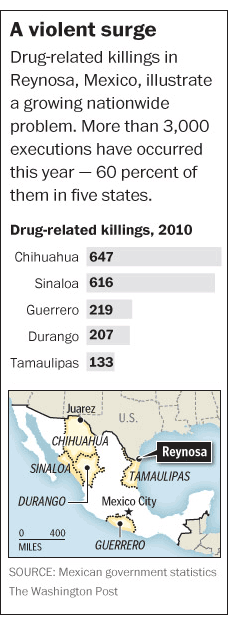
Throwing in a map is smart – most Americans do not know where all the Mexican states are. Breaking the murders down by location is also smart. A national total would obscure part of the point, which is that the drug wars in Mexico are not hitting the whole country equally. Some areas are much more important to the cartels and are getting walloped while others are relatively unscathed, at least in terms of murders and other violence. Including the map and breaking the graph down by geographical boundaries both communicate the geographical specificity of the murder problem.

What needs work

This graphic illustrates just one element, one metric, of a whole constellation of economic and social problems. In journalism, getting any graphics into an article on a tight deadlines is difficult. One could argue that since the troubles in Mexico are not so new, it might be worth putting some extra time into the production of a graphic that could display murders, kidnappings (of whom and for what purpose – money, political deals, revenge), the quantity and type of drugs trafficked from which areas, trafficked/processed through which locations, for distribution where and by which cartels.

Besides a comprenhensive narrative of the trade, which is probably nearly impossible to construct because if it were easy to get information about where drugs are grown, processed and distributed I would be amazed. However, there is at least one other way to demonstrate the violence in a more comprehensive fashion, just by making some assumptions about social/economic networks with respect to the people murdered. The information on kidnappings may not be available – the article mentioned that five journalists had been kidnapped but only one was reported to the police. So we are left with murders, and that is probably why the Washington Post ran the graphic that it did.

Widespread murder creates a terror society – one in which fears and suspicions impact daily life over a sustained period of time. But it can be quite difficult to quantify terror and many graphics rely on quantifiable data. The article is well written and its narrative does a good job of conveying the magnitude of the drug violence and its encroachment on the lives of everyday folks.

The spasm of killing, kidnapping and extortion in the northeastern states of Tamaulipas and Nuevo Leon — vital trade, energy and manufacturing centers on the Texas border — marks a serious escalation in the U.S.-backed drug war and comes with a 21st-century twist: Mexican officials struggle to calm what they call a mass psychosis of fear, stoked by social-media chatter and grisly YouTube videos, by using Twitter to post warnings about “situations of risk.” — William Booth

There is clearly good reason for graphics to accompany text – each play unique roles. That being said, I still think there may be a way to create a network graph that demonstrates the social span of the violence. It could look at one of the hard hit communities in which all people are assumed to be alive and unrelated to anyone who was murdered. Let’s imagine one dot for each person, colored green to show they are alive. Now, a person who is murdered will become a black X and all of their family members and close friends will become black dots (still alive, but severely impacted by violence since they lost friends or family). In a perfect world, more distant friends would become brown dots. But it would be difficult to make a map like that because it is difficult to identify looser friendships. Use guest books at funerals to gather data? Facebook? Hard to say. Kidnappings, where known, could be similarly mapped. After constructing a network map like this, it would be much easier to see that one murder impacts a much wider swath of a community. Once there are many murders, there will be very few people left as green dots. Widespread murder is like necrotic tissue.

Where the persons murdered and kidnapped were wage earners, it would also be possible to demonstrate the income lost by the community as compared to the estimated value of the trafficking activity over a given time period. Of course the value of human life should not be measured by the money they failed to earn because they were dead. It’s just as silly as reducing the value of a human life to the market value of the chemical components of the human body. The point of such a comparison would be to demonstrate the economic impact on the community rather than some sort of death calculus.

References

Booth, William. (21 April 2010) “Drug war violence appears in Mexico’s Northeast, near Texas border”. In The Washington Post, World, North America section.

Antipsychotic drugs for kids with private insurance vs. Medicaid - New York Times

What needs work

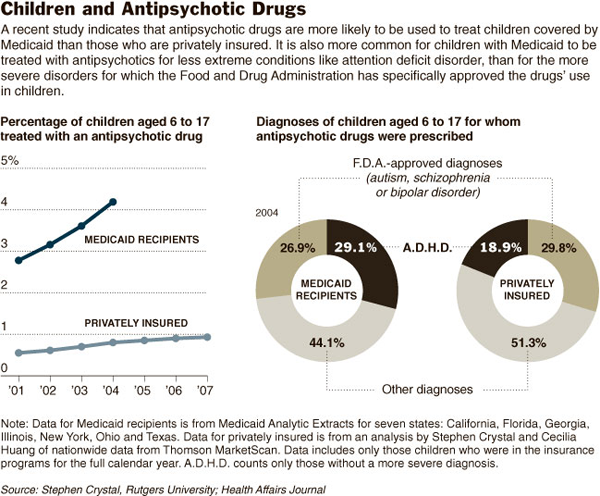
Forget the line graph for now and look at the donut chart. Pie charts are hard enough to read, I think donut charts are even harder. I would prefer that the donut get stretched out like in the literacy in the US graphic from last week. It’s easier to compare the length of a line segment than the length of a curve.

There is an obscurantist move going on with the use of percentages here. What we need to contextualize the data shown is the percentages of children on Medicaid and with private insurance who seek mental health diagnoses in the first place. Maybe the privately insured are self-selecting more intervention, even where it’s unwarranted, because their kids might be in schools that are more sensitive to classroom disruptions or for some other reason. In that case, a more sensitive trigger that sends these privately insured kids to the doctor in the first place would render the finding that fewer of them have serious problems not nearly so alarming as the article makes it out to be. The article implies that as a society, we are stigmatizing poor children as mentally unhealthy and prescribing them drugs with serious side effects. If that is what is happening, it is truly uncool. But I don’t feel like we can come to that conclusion based on this graphic. Not enough contextual information.

Furthermore, the slush category is just too big. Over half of the privately insured children are receiving “other diagnoses” and 44% of the kids on Medicaid find themselves in this category as well. I really don’t know how to fit that into the argument that Medicaid recipients are receiving drugs for lesser disorders than privately insured children. The category is so large and so ill-defined that it offers no contextualization for the diagnoses that the article is most interested in – namely, ADHD and autism+schizophrenia+bipolar disorder. Maybe the kids in the slush category are receiving essentially the same sort of diagnosis except that prescription drugs are not involved. We have no idea what is going on in this category and it is too big to write off.

The article points out that prescribing drugs for the treatment of psychotic disorders in children should be done quite carefully because the drugs carry many side effects. I think that the narrative of the article could have been strengthened by a graphic that fixed the above-mentioned problems as well as describing the more qualitative outcomes of the drugs. Show me a graphic of what happens to a kid who is properly diagnosed and takes the drugs (weight gain, etc) vs. a kid who should have been diagnosed and treated with drugs but wasn’t (more suspensions, etc.) vs. a kid who received non-drug treatment for a correct diagnosis vs. a kid who received drugs but had only a sub-clinical problem that shouldn’t have been medicated. And for the economists, throw in the economic cost of these various treatment options.

References

Wilson, Duff. (2009, 13 December) Poor Children Likelier to Get Antipsychotics New York Times, Health Section.