What works
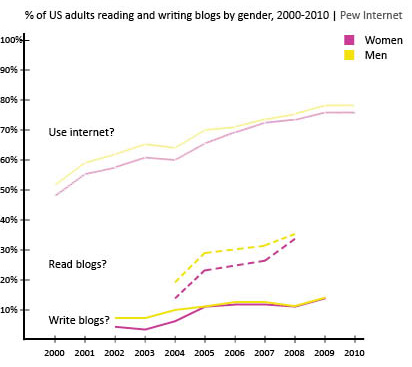
This graphic was created using a wonderful, if not entirely complete, massive Excel spreadsheet summarizing interview results from the Pew Internet Project. There are many more questions than the three I looked at. I am primarily interested in how many adults write blogs and I was happy to see that the Pew Internet Research center has been asking adults about their blog reading and writing practices for about a decade. Just to give it context, I also plotted the percentage of adults using the internet at all.
I am also interested to see that women and men write blogs at about the same rate, these days, even though I know that they aren’t writing the same kinds of blogs. Food bloggers, for example, are overwhelmingly women as are baby bloggers (aka mommy bloggers, but using the term ‘mommy’ is too gender-restrictive). Political bloggers and tech bloggers tend to be male more often than not, though I know less about them.
What needs work
The interviews are different from year to year – some years I was averaging five or seven data points on the same question and some years I had only one (or, sadly, none). I wish there had been more years of data available on blog reading, for instance.
If I had one takeaway point it would be that we need to keep funding places like Pew to conduct detailed, ongoing research. I have found it invaluable to have access to their research and it makes the work I am currently conducting about food bloggers relatable to a wider body of practices.
References
Pew Center for Internet Research. Usage over time spreadsheet.
— If you cannot click on that link and automatically start a download, try downloading it from the Pew website

Comments 1
Sasha — August 19, 2011
Interesting statistics.
I was expecting more male bloggers, because they make the majority of tech community that is very active in blogosphare. Basically, every other software developer is blogging. Anyhow, it's nice to see these stats.