What Works
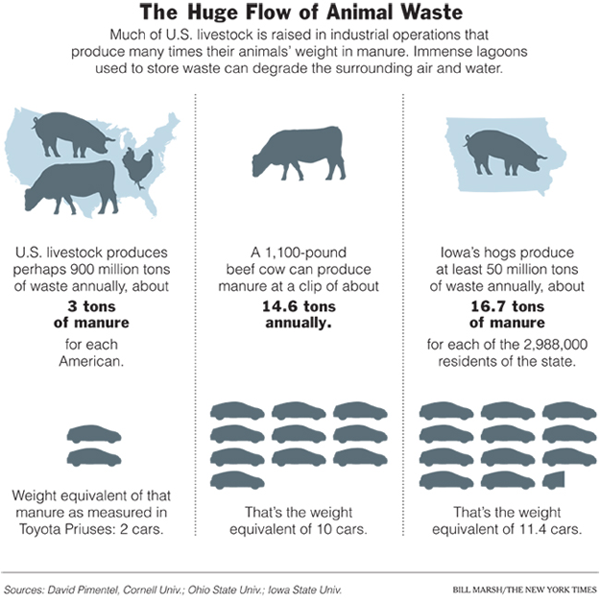
The clean color palette gives this graphic the aseptic look of ‘pure information’ while the inclusion of the numerical data (in tons of manure) backs up the intention of the graphical representation with checkable facts. I like the three different versions of the same concept; it increases my confidence in the basic point that raising livestock produces vast quantities of waste. It’s mostly a pigs and cows problem but it isn’t restricted to Iowa.
Measuring animal waste per capita is a brilliant way to remind readers that they play a role in this system. These animals are a special class of animals called livestock which means that they only exist to provide food for humans. Measuring waste per capita is a subtle, but incontrovertible way to remind us that all animal eaters are contributing to the pile-up of animal waste.
What Needs Work
The animal cut-outs overlaying the outline of the nation in the first panel and Iowa in the third panel seem like a first draft idea, not a final draft idea. The relative size of the animals seem to relate to their ability to fit within the outline behind them more than to relative proportions of waste.
I have no idea why animal waste should be related to the weight of a Prius. This is an unnecessary politicization of the data. There is no logical reason to measure animal waste in Priuses. I can only think of political reasons to do so. Tons is just fine. The Prius portion of this graphic could be lopped off and no information would be lost.
It makes sense to me to move sequentially through levels of analysis. In that case, I would have put Iowa in the middle so that our thoughts would move from largest level of analysis to smallest. This is especially true in this case where the Iowa level data and the national level data measure animal waste per capita while the cow’s waste is measured annually, not per capita. I would have translated the cow’s waste into per capita data, too, just to make the narrative of the graphic more cohesive.
Bittman writes, “Americans are downing close to 200 pounds of meat, poultry and fish per capita per year (dairy and eggs are separate, and hardly insignificant), an increase of 50 pounds per person from 50 years ago. We each consume something like 110 grams of protein a day, about twice the federal government’s recommended allowance; of that, about 75 grams come from animal protein. (The recommended level is itself considered by many dietary experts to be higher than it needs to be.) It’s likely that most of us would do just fine on around 30 grams of protein a day, virtually all of it from plant sources.” And that’s something I’d like to see represented in the graphic too – the fact that Americans don’t need meat to meet their nutritional needs. That isn’t to say we could easily do without meat – much of eating is cultural and from that perspective many Americans would be set adrift, at least from a culinary perspective, without meat.
Bonus: I would like to see more about the waste lagoons – something that talks about what happens to the waste over time would be incredibly useful because this graphic begs the “where does it all go?” question.
Relevant Resources
Bittman, Mark. (27 January 2008) Rethinking the Meat Guzzler in The New York Times, The World.
Flora, Jan; Chen, Qiaoli; Bastian, Stacy; Hartmann, Rick. (October 2007) Hog CAFOs: The Impact on Local Development and Water Quality in Iowa Report from the Iowa Policy Project.


