What Works
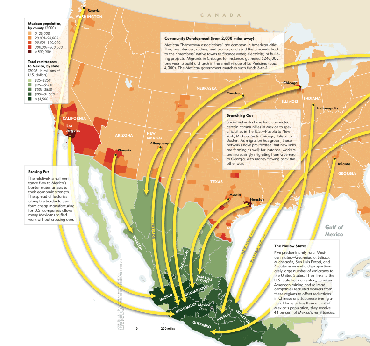
This map does a great job of demonstrating the granularity of the flow of remittances from particular cities in the US to particular cities in Mexico. It does a very good job of using a single characteristic – financial flow from the US – to illustrate a larger pattern of migration between sister cities in two countries. I talked to a restaurant chef-owner in New York on Monday and she said all of her cooks are from Puebla. This graphic could have told me about the same thing, though it wouldn’t have been able to tell me to look in the kitchen.
The graphic makes great use of color – picking one basic color for each country and increasing that color’s intensity to indicate concentrations of migration activity.
Credit for the article from which this was drawn goes to Raúl Hernández-Coss and credit for the graphic goes to Ryan Morris (I think, it’s really hard to read the fine print).
What Needs Work
Even in the bigger version of the graphic I can’t read the text in the boxes very well. I’m sure this looked good in print, but it didn’t translate well to digital. Still, even without being able to read the explanatory text, the basic point is obvious and legible.
Relevant Resources
Raúl Hernández-Coss. (2007) World Bank Working Paper 47 The U.S.-Mexico Remittance Corridor
Julie Watson (27 January 2009) Yearly Mexican Remittances Drop for the First Time in the Washington Post.
Matthew Quirk (2007) The Mexican Connection in The Atlantic. (This is where I first spotted the graphic)
