Archive: Dec 2009

Divorce rate - the short and incomplete story

Zoom in and it looks like poverty could be good for marriage

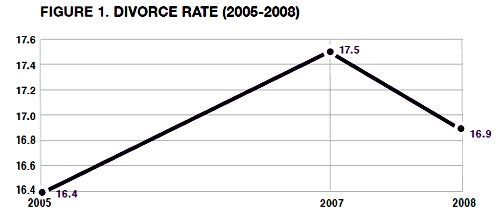
Philip N. Cohen from the Family Inequality blog (and the sociology department at UNC Chapel Hill) sent along the two line graphs in this post saying, “For the last week I’ve been steamed about these two figures from a report on marriage by W. Brad Wilcox.” [Note: W. Bradford Wilcox is the director of the National Marriage Project at the University of Virginia where he is also Associate Professor of Sociology.] The zoomed-in graph above was used in the main text to show that the divorce rate is going down during the current recession. Poverty must be great for marriage! No matter how folks feel about their spouses, they must feel more strongly about having enough money so they stay together. Or, to put it slightly differently: what unemployed person is about to leave the comforts of an intact home, even if that home is a disgruntled one?

Cohen goes on to point out that Mr. Wilcox’s strategy of zooming in on the data was also picked up by the media who are happy to run a story about the unexpected positive impact of the recession on lasting marriages.

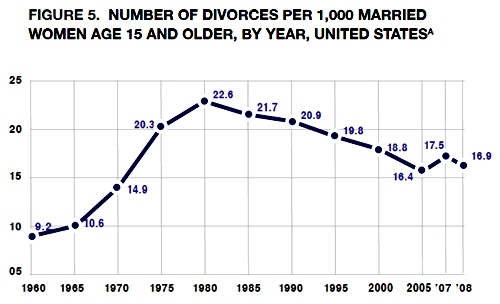
Mr. Wilcox did include a complete picture of the divorce rate since 1970 in his appendix which is copied below.
Divorce rate in the US |  1960 - 2008
Divorce rate in the US | 1960 - 2008

Zoom out and it just looks like the divorce rate hit a speedbump on the way down

As evidenced by this line graph, the divorce rate has been declining for years. The brief period of increasing divorce from 2005 to 2007 was more like a speedbump in a declining trend than the end of a trend of increasing divorce rates.

Read more about why this matters at Philip Cohen’s blog.

An improved graphic
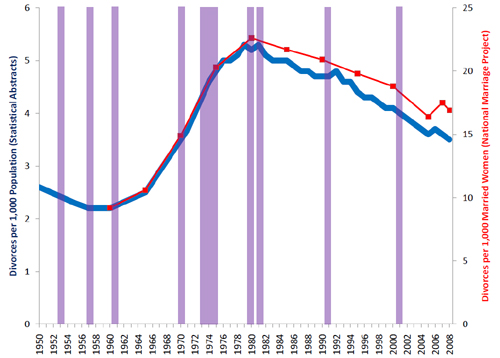
Philip Cohen's sketch including recessions in purple

My point is simply that all infographics tell richer stories the more data they depict. Zooming in is generally a bad idea because it reduces the context from which the reader can draw solid conclusions. If the recession were going to be part of the story about divorce, recessionary periods should be indicated on the graph, too. That would make it easier to tell if all recessions tend to decrease divorces or if somehow a decrease in divorce just happened to coincide with this current recession. It’s easy to ‘lie’ with info graphics by being overly selective. And lying just isn’t what we’re after.

References

Wilcox, W. Bradford. (2009, December 11) “Can the recession save marriage?” in The Wall Street Journal. Opinion Section.

Cohen, Philip. (2009) Recession, resilience, divorce?” in The Family Blog.

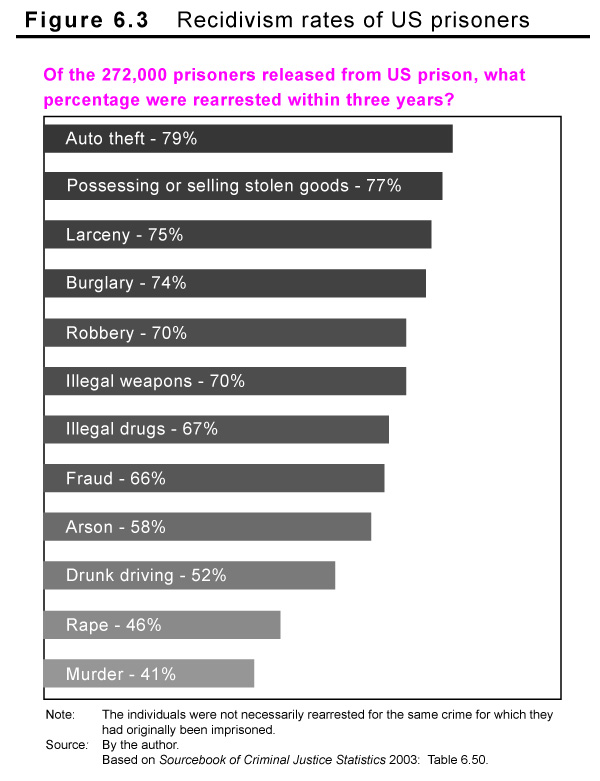
Recidivism rates of US prisoners - reduced color palette
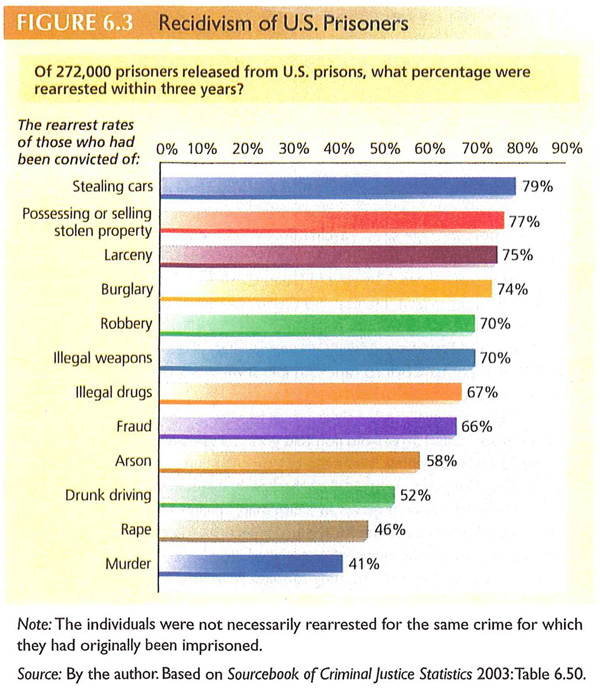
Figure 6.3 from Henslin's Intro to Soc - Recidivism of US Prisoners

On color

When architects draft plans and sections, they pay close attention to line weight. Part of the craft of draftsmanship is knowing which line weights are just right and making sure to apply the right line weight in the right instance. One of the criticisms older architects who were used to drafting boards and pencils levied against younger architects who draft using AutoCAD programs is that they just don’t do line weights properly. CAD displays layers in different colors and the younger architects were happy to rely on the appearance of these different colors as they worked on their monitors without making smart choices about line weights. When the documents were printed, all the lines could be the same weight, or if there were different line weights, they appeared to be arbitrarily chosen. Why were the older architects so upset? Because line weight carries meaning in architectural drawings. Get it right, and a simple section can speak volumes to the trained eye. Get it wrong and it’s like hearing a sentence without inflection (or perhaps worse, with inflections in the wrong places).

I feel the same way about color that the older architects feel about line weight. Color should mean something in a graphic. When the paint bucket comes out, there better be a reason for it beyond ‘decoration’. Graphic design is not about decorating otherwise drab diagrams. It is about enhancing the amount of information that can be communicated that privileges the image over the word because words always already require translation and the potential for misunderstanding.

The two bar graphs above depict the same information. One uses color with no apparent meaning attached to it – the bars are different colors just because it looks nice. The backdrop is yellow perhaps “to make the graphic jump off the page”. In my opinion, the full bleed back drop is like a heavy cloak, burying the information the chart contains in a Halloween costume. This Halloween celebration continues with the use of randomly selected colors for each bar on the chart. And the use of italics and bold where it isn’t needed is much like costume jewelry.

The gray-scale graphic uses color to highlight the originating question for the graphic. Each of the bars is shaded in accordance with the recidivism level for that crime – those imprisoned for auto theft have a 79% chance of being rearrested so that bar is 79% saturated with black. The bottom bar represents a 41% rearrest rate so it is 41% saturated with black. In this way, the saturation level reinforces the length of the bar and the numerical value printed in the bar.

References

Color graphic from: Henslin, James. (2009) Essentials of Sociology: A down-to-earth approach 8th ed., Pearson Publishing: New Jersey. Figure 6.3.

Gray-scale graphic: By Norén.

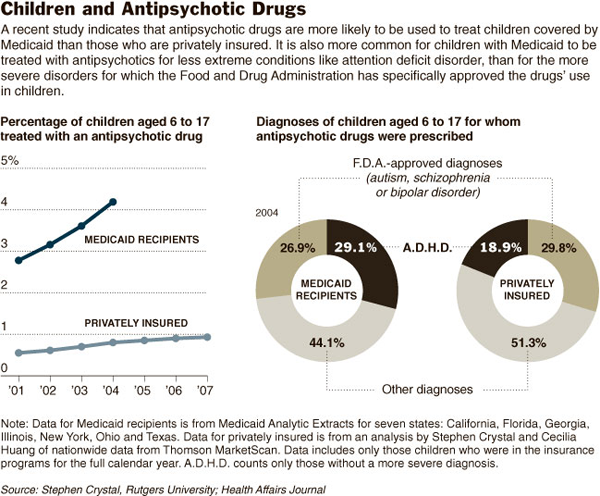
Antipsychotic drugs for kids with private insurance vs. Medicaid - New York Times

What needs work

Forget the line graph for now and look at the donut chart. Pie charts are hard enough to read, I think donut charts are even harder. I would prefer that the donut get stretched out like in the literacy in the US graphic from last week. It’s easier to compare the length of a line segment than the length of a curve.

There is an obscurantist move going on with the use of percentages here. What we need to contextualize the data shown is the percentages of children on Medicaid and with private insurance who seek mental health diagnoses in the first place. Maybe the privately insured are self-selecting more intervention, even where it’s unwarranted, because their kids might be in schools that are more sensitive to classroom disruptions or for some other reason. In that case, a more sensitive trigger that sends these privately insured kids to the doctor in the first place would render the finding that fewer of them have serious problems not nearly so alarming as the article makes it out to be. The article implies that as a society, we are stigmatizing poor children as mentally unhealthy and prescribing them drugs with serious side effects. If that is what is happening, it is truly uncool. But I don’t feel like we can come to that conclusion based on this graphic. Not enough contextual information.

Furthermore, the slush category is just too big. Over half of the privately insured children are receiving “other diagnoses” and 44% of the kids on Medicaid find themselves in this category as well. I really don’t know how to fit that into the argument that Medicaid recipients are receiving drugs for lesser disorders than privately insured children. The category is so large and so ill-defined that it offers no contextualization for the diagnoses that the article is most interested in – namely, ADHD and autism+schizophrenia+bipolar disorder. Maybe the kids in the slush category are receiving essentially the same sort of diagnosis except that prescription drugs are not involved. We have no idea what is going on in this category and it is too big to write off.

The article points out that prescribing drugs for the treatment of psychotic disorders in children should be done quite carefully because the drugs carry many side effects. I think that the narrative of the article could have been strengthened by a graphic that fixed the above-mentioned problems as well as describing the more qualitative outcomes of the drugs. Show me a graphic of what happens to a kid who is properly diagnosed and takes the drugs (weight gain, etc) vs. a kid who should have been diagnosed and treated with drugs but wasn’t (more suspensions, etc.) vs. a kid who received non-drug treatment for a correct diagnosis vs. a kid who received drugs but had only a sub-clinical problem that shouldn’t have been medicated. And for the economists, throw in the economic cost of these various treatment options.

References

Wilson, Duff. (2009, 13 December) Poor Children Likelier to Get Antipsychotics New York Times, Health Section.

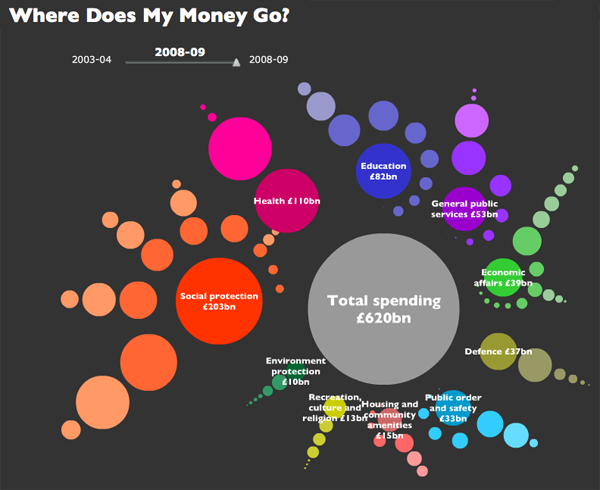
Where does my money go? in the UK - Open Knowledge Foundation, raphic by Iconomical

What works

This visually arresting graphic does a great job of presenting data about national spending in an apolitical but altogether fascinating way. It’s interactive, by the way, but I’m not commenting on the interactive part, just the static graphic. I find that getting the static graphic clear is an important first step towards making a functional interactive graphic. If ever I hear someone say ‘but it’s interactive’ as an excuse for having a weak static graphic, I cringe. See my post about the USDA mypyramid food guide for a case study on the importance of a strong relationship between the static and interactive iterations of graphics as tools.

Each dot represents a different department or governmental program with the size corresponding to the funding level. Smart.

If you link through to the originating site, you’ll be able to follow blog posts that take readers through the development of the graphic. They ask for input and do their best to incorporate it. I like that approach. Good use of technology, OKF.

What needs work

I can’t quite tell why the circles are arranged the way they are or why their hues are the shades they are. Graphics, especially the beautiful ones, are the best when their simple clarity gives way to an elegant complexity. In other words, when I pose the question: “why does the hue vary within given funding types?” I’d like the graphic to lead me to an answer. I’m sure there is a reason for each hue, I just haven’t been able to figure it out.

One tiny, American-centric request: Add ‘UK’ to the page or the graphic somewhere. Maybe change “Total spending” to “Total UK spending”. Or “Where does my money go?” could be “Where do UK taxes go?”. These here interwebs are global. Yes, of course, the £ symbol tends to give it away. Maybe I’m just being too picky.

References

Open Knowledge Foundation. (2009) “Where does my money go?” United Kingdom. Data available

Drug related deaths increase - Associated Press article based on CDC data

What works

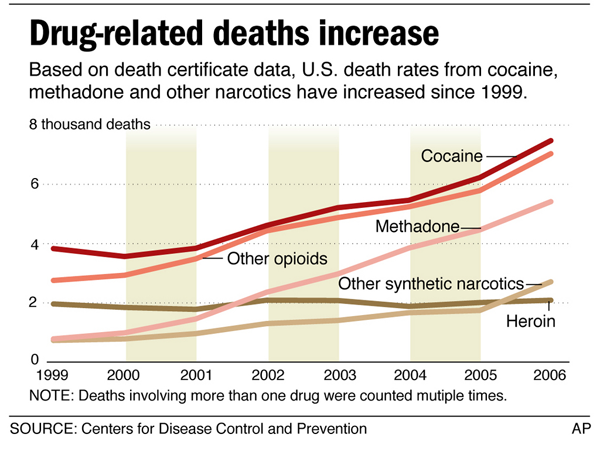
A simple line graph shows that more people are dying from methadone than heroin and the difference is growing over time. It also shows that cocaine is more dangerous than anything other drugs on the graph, at least when it comes to fatalities. Note that these data represent deaths due to acute overdoses as well as fatalities due to complications from long term use.

What needs work

I have no idea what the bars behind the line graphs represent. They seem to be there just to be graphic – I am not in favor of the use of meaningless graphic dross. The article that accompanied this graph mentions that 39,000 people die every year due to drugs and 45,000 die in traffic accidents (though auto-deaths are dropping and were at ~37,000 in 2008 according to Fatality Analysis Reporting System). This means that in some states – mostly in New England and the Mid-Atlantic – more people are dying from drugs than cars. This is big in America where traffic fatalities have long been an unfortunate fact of life. Safety standards have been improving so traffic deaths have fallen. I would have liked to see the traffic deaths applied to this graphic. It would have been more meaningful in the context of the article than the random bars behind the lines.

Where are alcohol related deaths?

The labels go from the very specific “Methodone” to the incredibly vague “other synthetic narcotics” and “other opioids”. The article says that the growth in drug-related fatalities is coming from prescription drugs like Oxycontin, Vicodin, and Methadone. OxyContin and Vicodin contain hydrocodone which places them in the “other opioids” category but it seems like it would also place them in the “other synthetic narcotics” category.

There are plenty of people who will not read the whole article. The graphic needs to speak for itself with clarity, complexity, and completeness otherwise it risks oversimplification and obfuscation.

Bonus graph

Oxycodone in grams distributed per 100,000 Population, Arizona and US, 1997-2006

The Proceedings of the Community Epidemiology Work Group, January 2009 included a presentation by James Cunningham that featured this data about the increase of oxycodone across the US population. I think this graph helps contextualize the oddly stylized line graph that is the central focus of this post. Here you can see that there is simply much more hydrocodone around than there used to be. The original article by the AP attributes this to the recognition of the treatment of chronic pain as a new and challenging medical field. In that case, then, it should be no surprise that Arizona is a hotbed for hydrocodone prescriptions because the state’s demographic is over-represented by the elderly who are more likely to need pain management strategies.

Final question

I don’t usually get political, and I’ll probably regret posing this question, but here goes.

Do drug companies bear any responsibility for the fatalities involving prescription drugs? Clearly it is in their financial interest to sell an addictive product – and nobody denies that opioids are addictive. Big tobacco ended up having to pay out millions, but that’s because in the beginning, they denied that their products were so unhealthy that using them was potentially fatal. Opioid producers are not making claims one way or the other on the question of fatality beyond admission that the substances are addictive and should be monitored by doctors. This shifts the blame to doctors, but it is often the case that addicted patients will seek these drugs from all sorts of different doctors making it difficult for any given doctor to know just what the patient was prescribed by some other health care professional. It is important to note that opioids offer meaningful treatment for chronic pain where tobacco products did not play a legitimate roll in mainstream medicine and thus should not be banned or taxed, etc.

This brings us back to the original question: should big pharma take some responsibility for deaths due to use/abuse of the prescription drugs from which they derive profit?

References

Associated Press. (2009, September 30) In 16 states, drug deaths overtake traffic fatalities at cleveland.com

A bigger version of the graphic is here: Drug-related deaths increase

Hydrocodone fast facts from drug-addiction.com

Community Epidemiology Working Group. (2009, January) Epidemiologic Trends in Drug Abuse: Proceedings of the Community Epidemiology Working Group | Highlights and Executive Summary [PDF] US Department of Health and Human Services, National Institutes of Health.

"Who is coming to America?" GOOD magazine Transparency by Thomas Porostocky
Who is coming to America? GOOD magazine Transparency by Thomas Porostocky

What works

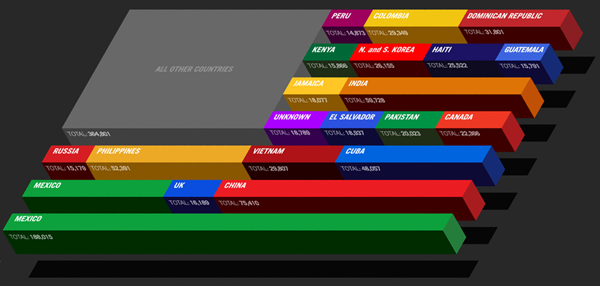
This is another graphic excerpt from GOOD magazine’s Transparency infographic collection. Note that I cropped out country-by-country break downs detailing how many people arrive as refugees and how many arrive as relatives of US citizens. Most immigrants to the US come as relatives of US citizens. That’s just how immigration law is set up, much to the disappointment of Bill Gates and other tech sector employers who used to frequently haul themselves to Washington to lobby for adding more visas for talented workers.

This graphic is clever, far more clever than many similar depictions of the same kind of data. I’ve seen pie charts where each piece of the pie represents a country. Bar graphs. Maps with a bunch of numbers and arrows. The concept here is both clean/easy to grasp at first glance and well executed. It would have taken me a minute to think of moving from a 2D flag to a 3D flag so that words and numbers could wrap the edges of the bars but I do think that helps present a cleaner image. Fewer characters on each bar.

Symbolically, it reminds us that America is constituted almost wholly by immigrants – this being the current numerical distribution of the countries of origin.

Though you cannot see it from the way I’ve cropped it, the text explains that these are LEGAL immigrants to the US. So, yes, Mexico sends the most legal immigrants to the US. That’s key. Americans tend to assume all immigrants from Mexico are illegal and that’s far from true.

Also, kudos for skipping flag textures on the bars. I’ve seen far too many similar graphics riddled with flags and that seems like a good idea but doesn’t work well because Americans just don’t know what the flags of other countries look like. Flags do not equal national icons, at least not in the eyes of Americans. Plus, if these bars had been wrapped in national flags it would have been symbolically interesting – America is made of all these different countries – but visually gross.

What needs work

I can’t tell from this graphic what the deal is with the “unknown” country category. I would have appreciated a little asterisk to clear that up (I know I cropped out a majority of the graphic so you can either take my word that there was no asterisk or you can click through to the full graphic above and check it out for yourself).

To emphasize the importance of Mexico as a sending country, I probably would have put it up in the shorter stripe area. Ditto for China. It looks like Mexico would have taken up two full short stripes and China would have taken a full shorty plus a little more.

I also would have found a way to group regions together. So El Salvador and Guatemala could have been close to Mexico and the Koreas and Russia could have been close to China.

References

Porostocky, Thomas. (2009, May 5) “Who is coming to America?” GOOD Magazine Transparency Infographic.

Migration Information Source clearinghouse for all sorts of information about US migration patterns, policies, and studies.

Excerpt from "Knot Tied" infographic at GOOD magazine
Excerpt from 'Knot Tied' infographic at GOOD magazine

What works

I cropped what you see above from an infographic that is part of GOOD magazine’s infographic section called Transparency. If you haven’t checked it out, I highly recommend it.

This was the strongest part of the graphic. It does a masterful job of elegantly illustrating a relationship both in space and time. We see that in 1998 hardly any states cared enough about gay marriage to have banned it or legalized it or had any kind of vote whatsoever. Except Alaska. Hello, Palin family. By 2004 the issue had hit the big time and gay marriage bans blanketed about half the country. The east coast showed signs of tolerance. Finally, in 2009, the east coast is holding out against a national tendency towards homophobia. Iowa surprises many by legalizing gay marriage.

What needs work

Please click through to the larger graphic. I feel that the map time series is by far the strongest part of the graphic. Perhaps because it is so elegantly simple, it was shrunk and deposited in the lower right corner.

References

Porostocky, Thomas. (2009) A History of Gay Marriage in Transparency, a section of GOOD magazine published out of New York and Los Angeles.

United States Literacy Rates - National Assessment of Adult Literacy

The key

Number of Adults in Each Prose Literacy Level

Prose Literacy

* Below Basic:
o no more than the most simple and concrete literacy skills
* Basic:
o can perform simple and everyday literacy activities
* Intermediate:
o can perform moderately challenging literacy activities
* Proficient:
o can perform complex and challenging literacy activities

What works

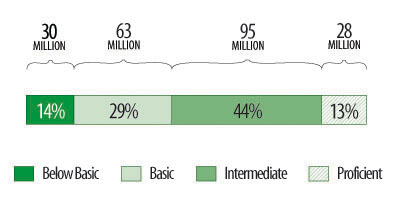
This is a simple way to do a bar graph when all of your bars will add up to 100%. Just think: they could have laid this information out in a standard bar graph with a separate bar for each level of literacy. This way, it’s easier to see that all these parts add up to a whole population.

It is alarming that there are more people ‘below basic’ than ‘proficient’ especially in the increasingly text-based world we live in. Emails and chat clients have replaced many phone calls which is especially critical for workers. (I wonder if on a per-communication basis it costs more to use the phone. Anyone seen data?)

What needs work

I would have tried to get the categories labeled within the graphic itself. Referring to a bulleted list is a bit cumbersome. On the other hand, I appreciate the desire to thoroughly describe what each categorical label actually means, and it would have been hard to elegantly place all those words into the graphic.

References

National Assessment of Adult Literacy. (2003) Demographics overall.

Work place bathroom design schematic

Work in progress

Regular readers will recognize this as a slightly modified version of a bathroom design I posted a couple weeks ago. I took some time to incorporate readers’ comments and hope you’ll continue to make recommendations.

Here are the major changes:

+ all the plumbing is routed through exterior walls
+ sight lines are improved so that it is more difficult for women to accidentally see the back of a peeing man.
+ there is no longer a trough sink – regular sinks instead. Cheaper.
+ if men really want to stay separate from women, they could wash their hands at the sink next to the changing station.

Request

Constructive criticism is still welcome.

John Kelly's map of the blogosphere

What works

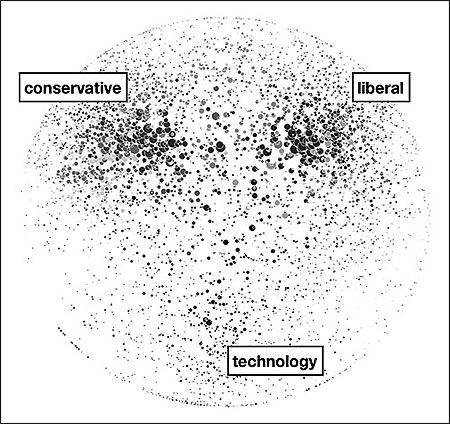
Oversimplification makes this a surprisingly legible collection of tiny dots.

What needs work

I have no idea how to trust this graphic. The labels seem arbitrarily applied – that could just as easily be food blogs, design blogs, and gossip blogs. Or maybe if you left the labels blank it could be a Web 2.0 Rorschach test.

The article is built around these key findings:
+ “The Web sites of legacy media firms are the strongest performers. The top 10 mainstream media sites, led by nytimes.com, washingtonpost.com, and BBC.com, account for 10.9 percent of all dynamic links.”

+ “By contrast, the top 10 blogs account for only 3.2 percent of dynamic outlinks.”

In other words, old media (still) rules. Not exactly sure why, if those two points are the primary arguments, the story ran with a graphic about politics and tech blogs dominating the blogosphere.

[As far as I can tell, the author agrees with me that it’s not even all that interesting to talk about why politics and technology dominate the blogosphere. Tech geeks are comfortable in cyberspace (they may even prefer it). So that’s a no-brainer. Blogs are perfectly designed to facilitate the dissemination of opinions what with the casual tone and the comment features. Politics is heavily rationalized opinion. Thus: blogs + politics = eureka.]

I would love to see someone write about the relationship between recipe trading and the development of the internet. THOSE are the blogs that are inexplicably everywhere. And the early users of the internet were happy to use primitive bulletin boards for trading recipes.

Bottom line

Just because it’s pretty doesn’t mean it’s relevant.

References

Kelly, John. (2009) “Mapping the Blogosphere: Offering a Guide to Journalism’s Future” The Nieman Reports. Nieman Foundation for Journalism at Harvard University.