What Works
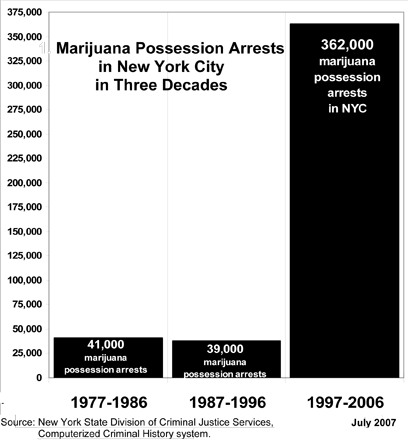
Sometimes simple is powerful. Everything here is well-labeled, the time periods move in even intervals and the source is cited. The point that arrests for marijuana possession have skyrocketed comes across almost instantly.
The graphic is taken from testimony given by Harry G. Levine, Professor of Sociology at Queens College and the CUNY-Grad Center to the New York State Assembly on Codes and Corrections:
“New York City has arrested about 100 mostly young people a day, every day, for the last ten years. By the end of today another 90 to 100 will be arrested. About 85% of the people arrested are Black or Latino, most are working class or poor, from the outer boroughs and from less affluent and poorer neighborhoods.”

What Works
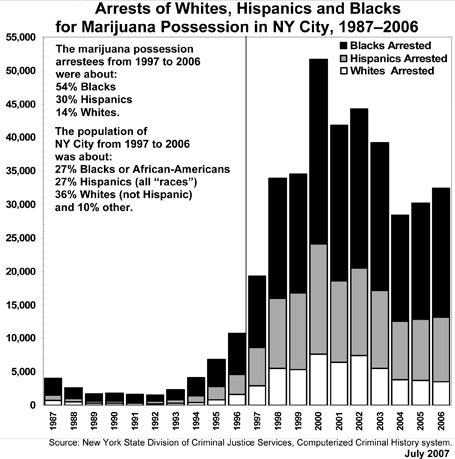
Levine includes this graphic in his testimony to demonstrate the uneven distribution of all these marijuana possession arrests across racial/ethnic boundaries. He is right to make sure to include a little decoder text about the distribution of whites, blacks, and hispanics as percentages of population of New York overall. Remember that in a world of equal arrest rates, whites would be arrested for possession roughly according to their percentage of the population, which is 36% in New York during the 1987-2006 period. But they were only accounted for 14% of the possession arrests. On the other hand, blacks should have been arrested 27% of the time but instead were arrested 54% of the time. Hispanics were the closest to even, representing 27% of the total population and 30% of the possession arrests.
What Needs Work
These stacked bar graphs always confuse people. So here we can use the y-axis to determine absolute number of arrests by racial/ethnic group but in other uses of this technique I’ve seen the bars all add to 100% and the viewer is supposed to suss out the relative proportion of the bar dedicated to the categorical break down. That clearly is not how this graph works, but still, where there is any chance of confusion, more work needs to be done to clear things up. I might have tried a hint of 3D, popping the white bar in front of the grey bar and the grey bar in front of the black bar just so that each bar reads as a distinct entity.
I would also have stuck the arrestee percentages directly next to the population percents. It would look more like:
Arrestees Population
Blacks 54% 27%
Hispanics 30% 27%
Whites 14% 36%
Simple to do. Makes much more sense to read that data across rows. I would then have stuck the color shading key to the left of that little table and cut the “blacks arrested”, “whites arrested”, and “hispanics arrested” labels which would have cut down on the total amount of text the viewer would have to read through.
Go ahead and click through to the full report to see the other graphics and read the whole story about the astronomical increase in marijuana possession arrests in NYC with the disappointing follow-on that the arrests are being doled out in minority communities disproportionately more often than elsewhere in the city.
One parting quote to provoke you to jump across and read it all, in response to why there are so many arrests so unevenly distributed across the city’s population, “it is not because of any dramatic increase in marijuana use – which has not changed significantly since the early 1980s. Nor is the dramatic racial imbalance in the arrests the result of marijuana use patterns. In fact, marijuana use among Blacks and Hispanics is lower than for Whites, and has been for decades, as U.S. government statistics show. “
One More Thing
If you’re wondering where all the weed comes from, as I was, you might want to link through to the 2007 article “Home Grown” in The Economist via Proquest (subscription required) which notes in classically dry Economist fashion, “Marijuana is now by far California’s most valuable agricultural crop. Assuming, very optimistically, that the cops are finding every other plant, it is worth even more than the state’s famous wine industry.”
Relevant Resources
Becker, Howard. (1953) On Becoming a Marihuana User originally in American Journal of Sociology Vol. 59 November 1953 (235-242).
Dwyer, Jim. (30 April 2008) On Arrests, Demographics, and Marijuana The New York Times, NY/Region Section.
Levine, Harry G. (May 2007) Testimony before the New York State Assembly Committees on Codes and Assemblies.
Schlosser, Eric. (2003) Reefer Madness: Sex, Drugs and Cheap Labor in the American Black Market. First Mariner Books.
Home Grown: Cannabis in California (20 October 2007) in The Economist Vol. 385, Issue 8551 (60).
