health

Conquest of Pestilence | Courtesty of New York City Dept. of Health via Glaeser

What works

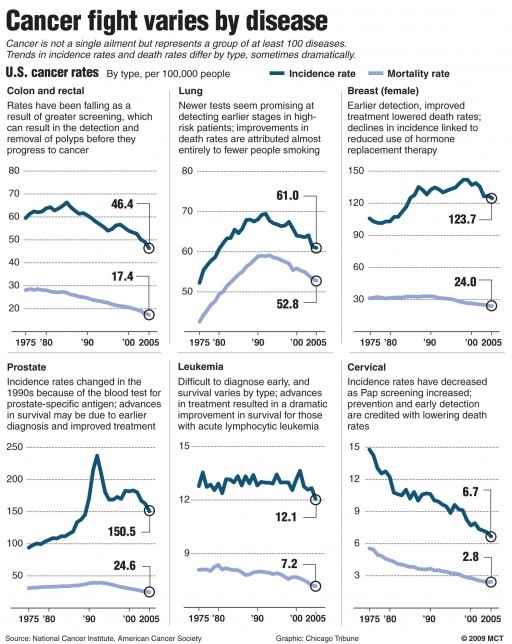
Ah, old-timey graphics. What works here is that this graphic reveals how far we’ve come, I think. The purpose is to show what percentage of New York City’s population died, annually. We can see the trend jumps around a bit – infectious diseases cycle through, sanitation improvements are made, the demographics of the population change – but mostly trends downwards. I like the inclusion of information about deadly diseases though I wouldn’t have just stuck labels on the peaks. The labels here clutter up the graphic territory and do not leave any room for adding other kinds of helpful trendlines and so on like that.

What needs work

Of course, there is not nearly enough context to make proper sense of this information. The implication is that the general downward trend is due to public health improvements, so of course the spikes are all labeled with diseases. I do not dispute that people were dying from cholera or typhus, I just want to hear more about what might have been causing people to LIVE (rather than just seeing what was causing them to DIE). What about demographic changes that shifted the population towards and then away from a preponderance of new immigrants? From young babies to slightly older people (who used to be at risk of death more than children and adults)? What of other changes (like, say, improvement in building codes that made the Triangle Shirt Waist Fire an anomaly rather than one of many similar situations)? What about income levels? The assumption is that as income rises, death rates drop, but I’d like to see that represented because it’s unclear just how rising income is linked to public health measures. Are we healthier because our increased contributions to the general fund (through taxes) go to support public health? Or is there simply something about being richer – either as individuals or as a collective – that leads to better health independent of the direct funding of public health?

More to come on Time Lines

I’m working on timelines this week but I want to create something new rather than just talking about existing ones which is going to take me some time. It will be a group effort, I strongly encourage you to send in your favorite time lines, your least favorite time lines, and comments about the time line I put together once I’ve got it posted.

Thanks much.

References

Glaeser, Edward. (22 June 2010) The Health of the Cities in The New York Times, Economix blog.

New York City Department of Public Health. [the image]

Cancer Rate Changes for Six types of Cancer

What works

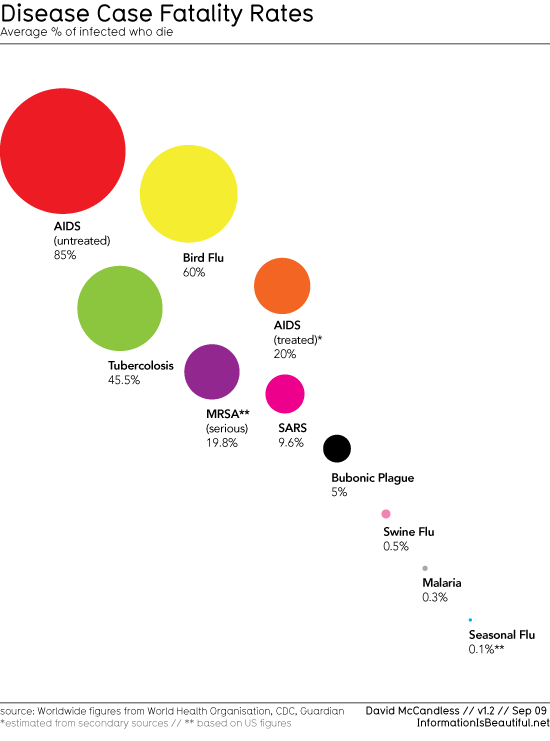
Cancer is not a single disease, as this graphic’s text reads, it is a collection of at least 100 diseases. This does a good job of showing how rates of infection and mortality vary from one kind to the next. The text explains cancer types for which targeted treatments have constituted a large part of the explained change in the rate of infection and mortality for particular kinds of cancer.

What needs work

Cancer sucks.

I don’t have more to say about this right now. I chose this set of graphs because it is of personal relevance. Don’t feel like being critical just now.

Disease Fatality Rates | Information is Beautiful

What works

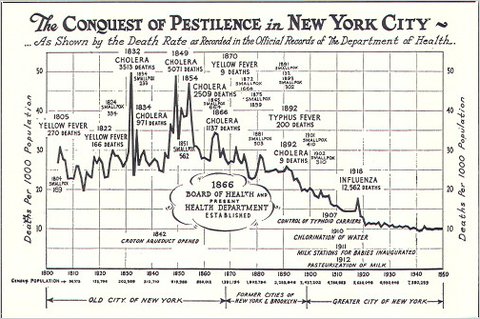
This graph is clean and balanced. Generally, it’s not good to abandon axes, and I don’t know if a social scientist could have gotten away with stripping them, but in this case, all the viewer needs to see is included next to each circle. The name of the disease is probably the most important element and that is easier to see right next to the dot than in some sort of axial label elsewhere. I’d also rather have the percentage values spelled out than have the circles simply plotted on a percentage continuum that I then have to mentally map. So it’s working for me. I’d also point out that if the axis had been a percentage continuum the flow of the cascade would not have been so elegant. Swine flu, malaria, and seasonal flu would have been more or less on top of each other. The way they’re presented here we can actually understand them a bit better than if they had been strictly plotted. The overall review is that relying on the principles of graphic design rather than relying on the principles of graph paper serves this particular data quite well.

What needs work

These colors strike me as being a bit too cheery for such a serious topic as disease fatality. While I am not the kind of graphics person who goes on and on about color theory, I do think that after sufficient cultural training (ie living in Western culture for a sufficient period of time or growing up here) will lead to a subconscious attachment of sentiment to particular colors. AIDS (untreated) and AIDS (treated) get the color tones more or less correct since orange and red are often correlated with anger, danger or aggression. AIDS is certainly an aggressive disease – any illness is experienced as an assault, in my opinion. Tuberculosis is also an angry, aggressive disease with a high fatality rate and yet it’s green. Green is related with invigoration, health, and the positive features of the natural order (that’s why all those bath products are green. Marketers like color theory.). Purple and magenta, especially when they are right next to each other as they are here, kind of look like carefree fun, the kind of fun associated with bubble gum, bike streamers, and pop rocks. So red and orange are working for me but green is a misstep. The colors for the rest could have been either shades of red or shades of gray and black. Yes, the graphic overall would have been more depressing, but that is the point.

Some information isn’t inherently beautiful and dressing it up as beautiful information may dilute the message. I think yesterday’s CO2 graphic was ‘beautiful information’ and yet it was only red, black and white.

References

McCandless, David. (September 2009) Fatal Infection at Information is Beautiful

For more on fatality rates
World Health Organization, CDC.

For more on circular graphics, see this newsletter [pdf]. I still dislike pie charts.
Few, Stephen. Our Fascination with all things Circular Perceptual Edge.