
What works
From the accompanying article New Normal on Wall Street: Smaller and Restrained, it is clear that Wall Street (at least as measured at Goldman and Morgan Stanley) did not have a great year in 2011 and certainly didn’t match their performance when financialization was at its height in 2006. The economic problems in the European Union are having an impact. The weak domestic economy is having an impact. Regulatory changes, especially the Volcker Rule, are having potentially long-lasting impacts by changing the rules that allowed banks to practice such widescale financialization in the first place.
The Volcker Rule, which is aimed at stopping banks from making financial bets for their own accounts, could permanently eat away at bond trading revenue. Efforts to strengthen the derivatives market — such as making sure that trades are properly backed with collateral — could deplete the profitability of this business.
Mr. Hintz estimates that a Wall Street bank currently makes a 35 percent profit margin on its derivatives businesses, but he thinks the new rules could shrink that to 20 percent.
The question remains: are these impacts part of a durable restructuring of financialized banking or are they something that the capitalist tendency towards profit-seeking can overcome?
The policy issue remains, too: keep your eye on the Volcker Rule – it may sound boring but it matters and any changes to it or reinterpretations of it are worthy of your attention.
What needs work
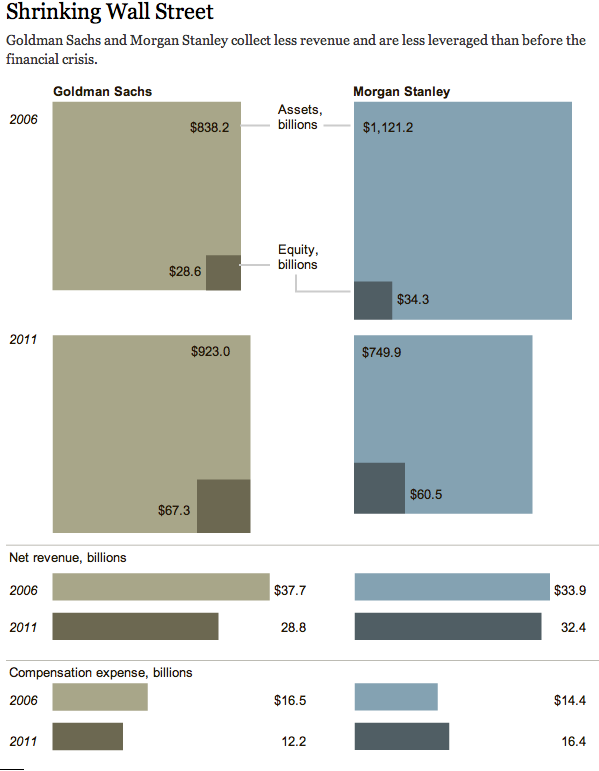
I’m not convinced that the graphic answers the major question: is this temporary or evidence of a lasting shrinkage of financialization? I’m not even convinced that the graphic does a great job of interpreting Wall Street’s current status as compared to 2006. At the very least, in this case I firmly believe the text is more compelling than that graphic.
- The graphic needs to do a better job emphasizing the asset to equity ratio*. In short, this is a reflection of way each institution is leveraging its assets. That ratio is often seen as one of the simpler ways to think about what financialization means. The greater the leveraging ratio (in visual terms: the greater the difference in the size of the equity box versus the assets box), the more heavily a firm is participating in financialization – generating money from money, rather than from, say manufacturing or productivity. One simple trick I would have tried: make the assets portion of the box even lighter to help suggest an ephemeral quality.
- I would love to see more than two years in this picture. If 2006 was the height of things, is 2011 like returning to 2005? Returning to 1990? We need more data points to fully understand this trend.
What I can’t figure out
Curiosity question: Why was Morgan Stanley more sensible about compensation in 2006 than in 2011? Wouldn’t we expect bankers to be taking less in compensation now, after the righteous indignation of the American public has rained down upon them, than they were before the crash? Yet in 2006, Morgan Stanley dedicated only 42% of its annual revenues to compensation while in 2011 it dedicated 50.6% to compensation. Is that good business sense? It surely doesn’t make for good PR if the banks are trying to suggest that they have to compensate their bankers for performance – their performance looks kind of crappy this year.
* I am a complete newbie when it comes to finance and financialization so please feel free to broaden, complicate, or wholly overturn my arguments here.
References
Eavis, Peter and Susanne Craig. (19 January 2012) New Normal on Wall Street: Smaller and Restrained Dealbook: NYtimes.com. Graphic: Shrinking Wall Street