What Works
Pie charts are quick and (too?) clean, in my opinion. Their beauty lies in their ability to make data legible – everything will add up to 100%. It’s a world without outliers or oddities and it fits neatly in a perfect circle. Because of this neatness, pie charts can be visually pleasing – I’m not suggesting this one achieves beauty, but the potential is there.
In fact, I’m including this gray scale pie chart that shows the share of airport traffic into the Middle East by city as an exemplar of a beautiful pie chart. One smooth swipe of a gradient.

What Needs Work
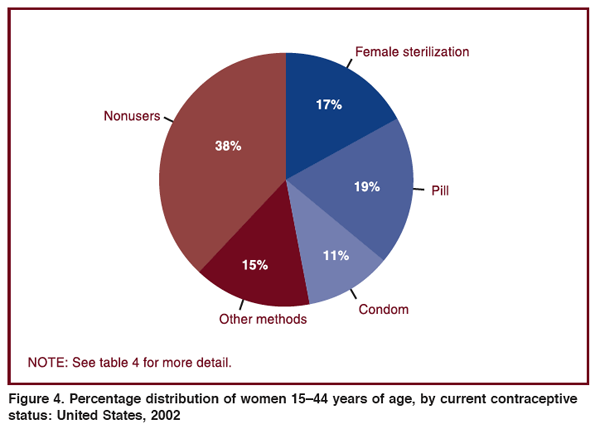
Pie charts either result in some kind of large residual category – like this one where “other methods” is clearly some kind of residual and accounts for more users than condoms. Interesting to me, the non-users category is also a bit of a catchall. In that 38% there are all sorts of different kinds of non-users. There could have been a 9.5% wedge for women who are either pregnant or trying to get pregnant. On the one hand, this is kind of a no-brainer: of course there are women who are trying to get pregnant. But honestly, I had forgotten all about that category when looking at this graphic because its caption tells me that I am supposed to be thinking about contraceptive users.
The other thing that this presentation obscures is the gender disparity in sterilization rates. We see that 17% of the women in the 15-44 year old age bracket are using sterilization as a contraceptive method. But how many men are sterilized? As a medical procedure, it is easier for a man to have a vasectomy than for a woman to have tubal ligation. Following that logic, one might assume that men are more likely to be sterilized than women, especially because some vasectomies can be reversed. Tubal ligations cannot be reversed. To their credit, they do include a table in the appendix that shows the rates of male sterilization in 1992 (6.1%), 1995 (7%), and 2002 (5.7%). Somewhat illogically then, rates of male sterilization are far lower than rates of female sterilization. What is happening here likely has something to do with the cultural construction of masculinity – male sexual activity following sterilization is likened to “shooting blanks” whereas I can think of no similar term for women (caveat: post-menopausal women might be referred to as “dried up” but this term is not typically used to reference sterilization).
Relevant References
Dudgeon, M.R.; Inhorn M.C. (2003 January) Gender, Masculinity, and Reproduction: Anthropological Perspectives International Journal of Men’s Health Vol. 2 No. 1. Harriman, TN: Men’s Studies Press.
Mosher, W.D.; Martinez, G.M.; Chandra, A.; Abma, J.C; and Willson, S.J. (2004, December 10) Use of Contraception and Use of Family Planning Services in the United States: 1982–2002 Advance Data from Vital and Health Statistics, No. 350. US Department of Health and Human Services, Center for Disease Control, National Center for Health Statistics.

Comments 2
Topics about Womens » Archive » Women’s Contraceptive Use - US — March 24, 2009
[...] At home with my friends created an interesting post today on Womenâ [...]
chuk — March 28, 2009
I'm not sure the above pie chart is very helpful. My first impression when I looked at it was, "Wow, only 40% of women in America don't use some kind of contraception." I motioned to my office mate to come over and check it out. But then we were like, "Wait a second, teen agers probably aren't sterilized, and newly-weds in the late 20s that are trying to have babies probably aren't using, and a lot of the older women I know don't take the pill..." It quickly became apparent that women probably jump all over the place on this chart over the course of their lives.
A few pie charts that controlled for things like marital status and age would probably be a lot more informative. Or maybe a bar graph that controlled for age and told us what proportion of women had indicated that they had used each one of these during their lifetimes (it couldn't be a pie chart because it could add up to more than 100%, since many women would have used more than one).