infographics

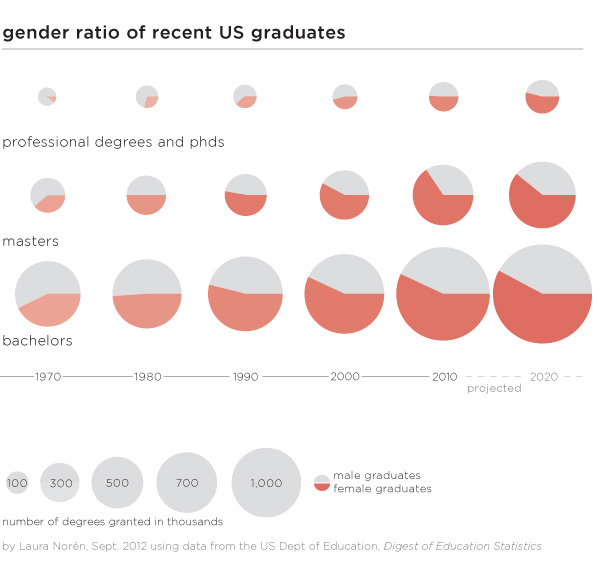
Graphic: Gender ratio of recent US graduates by degree
Gender ratio of recent US graduates by degree | Laura Norén | click caption for pdf

Is higher education “dominated” by women?

There has been plenty of news coverage recently about the rise of women and the decline of men. While I have always disliked the irrational use of zero-sum language – why do we have to frame this discussion as men who are losing because women are making some gains? – I thought it would be worth taking a closer look at the gender ratio in higher education. I found many text-heavy stories (the Guardian, the New York Times, the Chronicle of Higher Ed, Huffington Post, The Atlantic, and many others) about female students earning more bachelors but surprisingly few graphics.

Graphics can do an excellent job of summarizing the gender gaps as they have developed over time within bachelors, masters, and professional+doctoral degrees. One graphic, quite thought provoking. All of the three degrees were more likely to be earned by men in 1970. Then between 1970 and 1980 women made rapid gains which continued through the 1980s. The gains for women slowed down once they hit the 50/50 mark for both bachelors and masters degrees and I predict they will also slow down for phd and professional degrees. Though it’s hard to tell by looking at the graphic, women are earning the largest proportion of masters degrees (projected to be 61% in 2020) which is slightly more than the 58% of bachelors degrees they are projected to earn in 2020.

Why aren’t women earning more if they are so well educated?

There is still a pay gap in earnings between men and women. Within the university, male faculty members tend to make slightly more than female faculty members. Overall, the most powerful explanation for pay gaps is not so much a failure to pay men and women equally for the same job. Rather, women are more likely to get degrees that lead to positions which are paid less than the positions men are more likely to get following their collegiate specializations. More women end up in education and nursing; more men end up in engineering and computer science. Education and nursing are not as likely to be lucrative as jobs that require engineering and computer science degrees.

To answer the question about women “dominating” higher education it is clear from the numbers that there are more female students at every level, though some majors still tilt towards men. What’s perhaps more important, women may or may not go on to match the earning potential of men, in part because they may not always choose the majors that lead to the most lucrative careers. Some argue that earning potential should drive choice-of-major but I’m still of the mind that going to school is not all about (or even primarily about) producing good workers. Going to school is about taking the time to explore different ways of thinking in depth and without undue concern for their ability to produce economic return. I’m glad that we have gotten to the point where there is enough gender parity to return to conversations about what school is for rather than who school is for…

Does the gender gap in graduation rates vary by race/ethnicity?
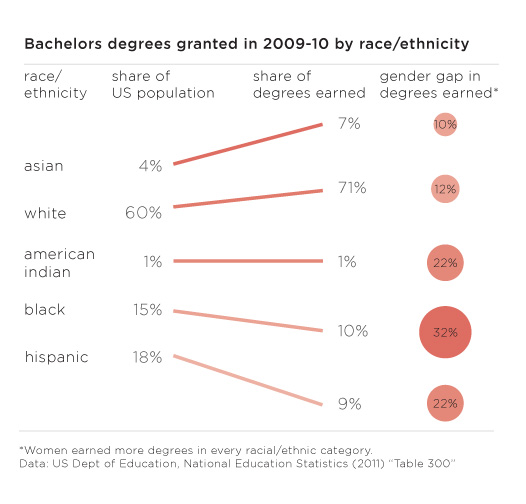
Graphic: 2009 US bachelors degrees by race/ethnicity and gender
2009 US bachelors degrees and gender gaps by race/ethnicity | Laura Norén | click caption for pdf

…but on the other hand, there are still critical gaps in access to higher education and degree completion that trend along racial/ethnic lines (class lines, too, but I didn’t get into that in this post). The graphic above displays the share of bachelors going to different racial/ethnic groups in 2009. In order to provide a relevant framework for comparison, I plotted the share of degrees earned next to the share of the total population of 18-24 year olds constituted by each racial group. There are some missing categories – mixed race people, for instance – but I couldn’t find graduation rates broken down any further than the five traditional racial/ethnic categories. Asians and Pacific Islanders only make up 4% of the population but they earn 7% of the bachelors in 2009 and their gender gap that year was only 10%. Whites were similarly over-represented in degree-earners and had a similar gender gap of 12%. But then things got interesting. The gender gaps for American Indians and Hispanics were much higher at 22% and the gender gap for blacks/African Americans was even higher still at 32%.

Especially when it comes to studying gender which is often constructed as a binary in which both groups make up about 50% of the whole, it is important to realize that analytical rigor might be increased by further segmenting these gender categories by some other key analytical variable. In this case, adding vectors for race/ethnicity provided a new perspective, one that might be a decent proxy for class.

References

Norén, Laura. (4 September 2012) Gender ratio of recent US graduates [infographic] New York.

Norén, Laura. (4 September 2012) US bachelors degrees by race/ethnicity [infographic] New York.

National Center for Education Statistics. (2011) Table 283: Degrees conferred by degree-granting institutions, by level of degree and sex of student: Selected years, 1869-70 through 2020-21 [Available in html and xls] US Department of Education.

National Center for Education Statistics. (2011) Table 300: Bachelor’s degrees conferred by degree-granting institutions, by race/ethnicity and sex of student: Selected years, 1976-77 through 2009-10 US Department of Education.

US Census Bureau. (2012) Table 10: Resident Population by Race, Hispanic Origin, and Age: 2000 and 2009 In The 2012 US Statistical Abstract. [Available in pdf and xls.

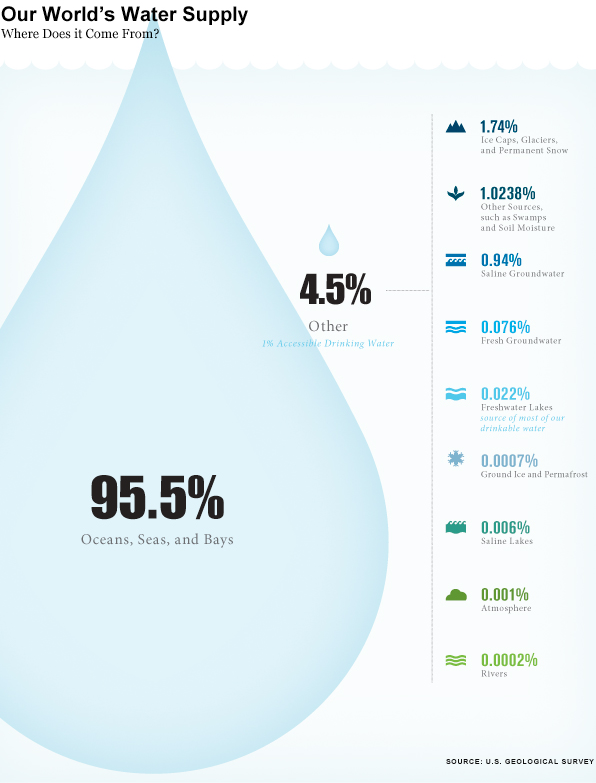
World's water resources by type of water, via The Atlantic data from the USGS

Is Minnesota like Saudi Arabia?

Minnesota is the land of 10.000 lakes and thus holds far more than its representative share of precious fresh water. Is this synonymous with the naturally granted wealth of oil in countries like Saudi Arabia? Maybe. But does that mean Minnesota is going to become a state with a similar level of political economic power? No…not so much. It is silly to compare nation states like Saudi Arabia to states in a federation like Minnesota; it is silly to think that a state with an existing economy relatively unreliant on water is going to suddenly transform itself into an economy with a single primary commodity; it is silly to think that a democratic governance system will respond like a dictatorship did to a valuable commodity. As an aside, Tim Mitchell’s latest book, Carbon Democracy makes a historically grounded argument about the relationship between the material qualities of oil and coal and the technics of the political economy that developed in concert with carbon-based wealth.

How are information graphics like propaganda?

This infographic is more than half graphic (and less than half ‘info’). Normally, that’s not the best balance for displaying social science data. Usually, social science data is multi-faceted, requires a contextual framework for adequate understanding, and the sheer amount of information necessary to tell the story makes it harder to include graphic elements that do not represent information. However, this is not social science data. Technically, it is geological data, but I think it would be more accurate to describe it as data that is being mobilized for political reasons. Hence, the title of this post makes a blatant comparison between water (blue gold) and oil (black gold) to emphasize the implicit political valence of the message in this graphic.

In short, information graphics are being mobilized for what are essentially purposes quite similar to propaganda. This particular graphic is not the best example. It is the example I happened to see yesterday, and it does a good job of demonstrating what is at stake in the current infoscape with respect to information graphics. These graphics are generally considered to be intellectual and political lightweights compared to communication that is based on the production of critical texts. Overlooking the work that these graphics do is both dangerous and foolish. For one, many critical voices from within the academy *have* critical messages they have trouble communicating with broader audiences because many audiences are unlikely to read academic writing, even if that writing is posted to blogs. If these academics can create their own graphics, they add another tool for communicating clearly just what their perspective is. Yet pretending that information graphics are either merely ‘pretty’ or that they are straightforward representations of empirical data avoids engaging with the way that political messaging is built into graphic design.

One reason this blog exists is to help people start to sharpen their critical visual analysis tools. As educators, we spend a lot of time in the classroom teaching students how to write and how to stop believing everything they read by becoming aware of rhetorical moves, selective mobilization of facts, and reliance on carefully chosen narratives that initiate particular kinds of human perceptual biases and emotional responses. Art historians teach the same kinds of critical skills for interrogating paintings and photographs. Media studies folks teach the same kinds of skills for interrogating popular culture products like television shows, films, and magazines. Social scientists would serve the discipline well if they begin to teach students how to critically consume information presented in infographics.

References

Thinking Big Series. (2012) The World’s Water Supply. The Atlantic. This series is sponsored by Fidelity Investments, LLC.

Mitchell, Tim. (2009) Carbon Democracy: Political power in the age of oil. Verso.

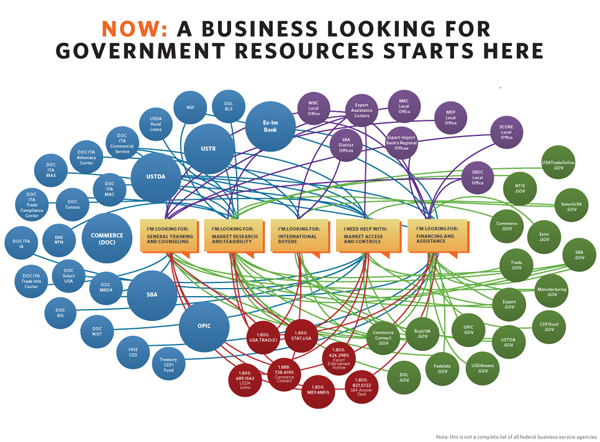
The detailed view (before) | whitehouse.gov

What needs work

The complete view of the bureaucracy in the federal government is totally confusing, even when it is color coded and arranged so as to be easily viewed from 30,000 feet (see above).

BusinessUSA initiative aims to make it easier for businesses to interact with the US Federal government

What works

The US Federal Government has copied a kind of 311-style approach to helping businesses navigate the portions of the federal bureaucracy relevant to them. One department, one number, one website.

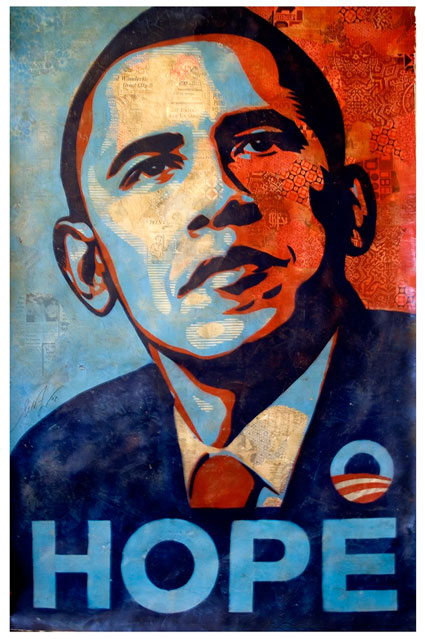
What interests me the most is the choice of those in the White House to promote this program through information graphics. This reflects the visual skills of Obama’s administration which have been evident since the middle of his campaign where not only those like Shepard Fairey but also his official campaign team launched an extremely successful visual campaign.

Shepard Fairey - HOPE
Obama Campaign Logo, 2008

The White House choice to use graphics in order to explain and promote their simplification of a portion of the federal government is also evidence of a growing shift towards the use of infographic stylings in the service of persuasion. Infographics gain a great deal of traction from the notion that humans tend to believe what they see. They gain even more traction when they mobilize numerical data that many people feel uncomfortable processing on their own. This graphic manipulates that sense of visual numeracy by taking a network (nest?) of dizzying resources and simplifying it into three nodes, each of which will bring businesses to the same pool of resources. ‘From many, one’ is an extremely powerful message, made all the more powerful by the strength of this visualization – it is clean, the nest part is detailed, and the resolution in the ‘one’ is not represented as a single node (which wouldn’t work as well because it would appear hyperbolic and would efface the modern entry modes into the federal government – the phone and the internet).