What works
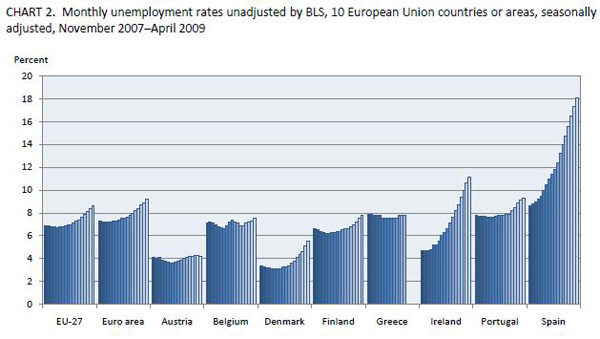
I was looking around for a nice EU-contextualized graph showing Spain’s unemployment rate. I found what you see above which shows unemployment rates in other EU countries. That was one of my requirements – in the EU economics are sort of local and then again not so local so it’s silly to try to look at one country without taking into account the others nearby. What we see, and what has continued since this graphs last data point in 2008 is that Spain has a notably high unemployment rate. News earlier this week put the current unemployment rate here (yes, I’m in Spain) at 19.7%.
Personal anecdotes with no scientific validity whatsoever
When I’m out on the street, I would say this appears to be true – everyday is like a holiday! Well, not really. There are no parades or obvious drunkenness. But there are all sorts of young, able-bodied folks walking around, having a caña, getting on with life. People’s demeanors and attitudes do not, on their surface, suggest depression, destitution, or downtroddenness. Furthermore, I had the brazenness to open my American mouth and ask a Spaniard man I barely know what he thinks of Spain’s economic situation. He said that the unemployment rate is not at all reflective of the actual unemployment rate because everyone is working under the table. That sort of reality, if it is true, would not be reflected in graphs like the ones above and below. If people are working under the table, I can’t imagine they have full time positions just judging by how many young capable-looking people are on the street on weekdays.
What needs work
I don’t know about you, but I don’t like the gradient on the graphs. Seems superfluous. I would have lost the grey background and just gone with some rather straightforward area blocks (no lines between each bar in the graph). In simplifying that portion of the visual, I think there would have been space for more contextual data. I’m no economist, so I looked around to see what economists think of as smart ways to contextualize unemployment rates.
I found this (which has a Spanish focus):

What works
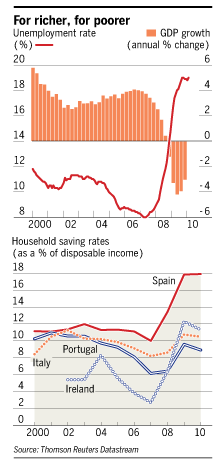
The story here is that – oh yes – we can see that unemployment rate bouncing right up. But we also see that Spaniards are saving more. This has been attributed to the expectation by Spaniards that they are going to be taking in their out-of-work sons, daughters, and assorted other relatives during this crisis. We would be shocked to have such a high savings rate in America.
What needs work
I am still trying to figure out what is going on in Spain. At least as I perceive the general attitude, Spaniards appear to be prepared to weather this little ripple in the amazing growth of their prosperity over the last 60+ years by either working under the table (maybe) or leaning on family. Is an 18% savings rate meaningful in the context of a nearly 20% unemployment rate? Will this crisis simply introduce more inequality – those with stable jobs will go unscathed while those without steady unemployment sink lower than family are able to stoop to help them out? And if my man on the street is any kind of correct and the unmeasured economy is booming, how do we measure it?
If you happen to have some expertise on any of these questions, please post to the comments.

Comments 2
afinetheorem — June 4, 2010
Savings rates tend to increase, and inequality tends to fall, during economic recessions. The inequality falls because investment returns are more variable than wages, and the rich have a greater percentage of income from investments. The savings rate tends to rise because there are fewer good investment opportunities (i.e., the Spanish are not buying a bunch of Costa del Sol houses anymore). Indeed, during a recession, you do not want the savings rate to increase - Keynes famously calls this the "paradox of thrift".
I am sure there is under the table work going on, but Spain really is in dire economic times. The unemployment rate among the young in unbelievable, in particular.
Spain's economy in infographics » Graphic Sociology | Spain — July 27, 2010
[...] Spain's economy in infographics » Graphic Sociology [...]