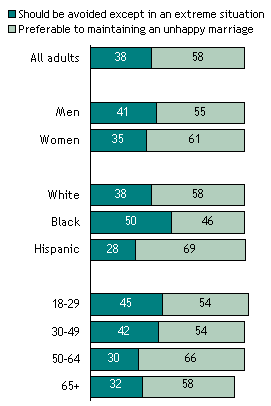
Also in the original graphic: Notes: Whites include only non-Hispanic whites. Blacks include only non-Hispanic blacks. Hispanics are of any race. Don’t know responses are not shown.
Survey Date: February 16-March 14, 2007
What Works
This is one simple way to display data that is supposed to add up to 100%. It doesn’t work well when there are more than two categories, but I would rather see two categories like this than see two categories in pie charts. Two category pie charts often end up looking like pac man which could be particularly unfortunate when it is divorce data that is being displayed.
What Needs Work
I don’t understand why there are colors here. Shades of gray are just fine and would give the graphic a cleaner look overall. More importantly, I am unsure that it makes sense to portray age, race, and gender as the same kinds of data. From a strictly technical perspective, age is ordinal data here but race and gender are nominal data. More broadly, thinking that gender and race and age are having similar impacts on how people feel about divorce just doesn’t make sense.
Another thing that bothers me is the missing data. Sure, there’s a disclaimer than don’t know answers aren’t displayed, but I kept fixating on the fact that the numbers didn’t add up to 100 as they should. I would show those don’t know’s since not knowing how you feel about divorce seems like a piece of data to me, not just something someone forgot. I can forget a behavior (like whether or not I locked the door behind me this morning) but I can’t very easily forget an attitude. I have trouble, for example, forgetting how I feel about leaving an unhappy marriage. It’s also hard to use an “I forget” response when the question has been posed. If you’ve forgotten, now’s the time to remember! How about it, marriage forever or leaving if you’re pretty sure you’d be better off alone? The point is, saying “I don’t know” to this question is a key data point, not just a trivial lapse of memory about what a behavior.
Relevant Resources
Pew Research Center Social and Demographic Trends Views about Divorce by Age, Race and Gender
