What works
I conducted a web-based survey of food bloggers last summer as a doctoral intern at Microsoft Research in the Social Media Collective. I am now analyzing the mountains of data that I gathered in the interviews (N=30), survey (N=303), and web crawler (N=30,000) and getting ready to send out papers for publication. I thought it would be nice to share some of the findings here in advance of the slow academic publishing process.
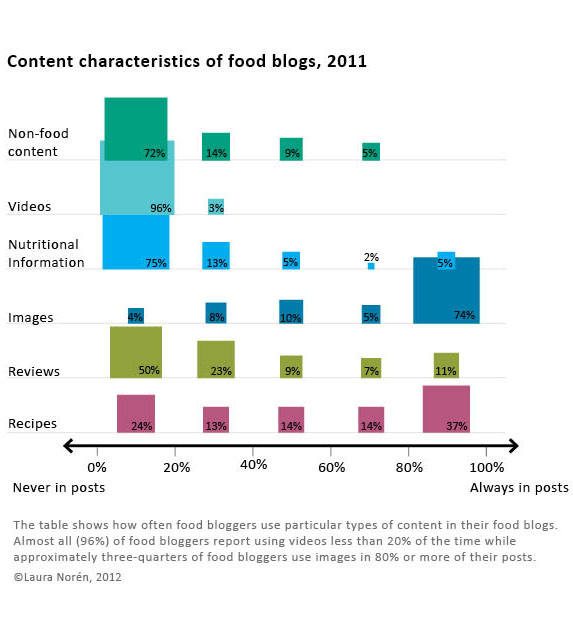
Since I made the graphic and since I am modest, I’ll just say that I like the colors and I like that I was able to find a way to keep all of the granular detail of tabular data while adding visual impact.
If you would rather hear about the substance of the study than about the struggles I had while creating the graphic, skip to the bottom third of the post and the “What surprised me” heading.
What needs work
Since I have the benefit of having seen the data I can say that two things certainly need work. First, the survey asked about many more behaviors than I have decided to depict in this graphic. I left out data mostly because I want to be able to publish it and publishers are not keen on accepting already-published material. Some of them are not too bothered if bits and pieces of the findings are blogged about here and there. Some of them are hugely bothered and will not accept submissions that have been written about on blogs at all. There are good reasons for subjecting the findings to peer-review – like having smart people verify that the findings are not fabricated from thin air or otherwise constituted by complete rubbish. All that being said, my biggest problem with this graphic is that it is just the tip of the iceberg in terms of what the survey had to say about the characteristics of food blog content.
The second big problem with this is that I had a very difficult time dealing with proportional data in the rows and the columns. In case you still haven’t figured out what this graphic is saying – and I don’t blame you if you find it hard to digest – the graphic is depicting the frequency with which about 300 food bloggers (303 to be exact) reported using the listed types of content. For example, 96% of food bloggers report using video 20% of the time or less. Video just is not all that common on food blogs and most food bloggers hardly ever use it. Images, on the other hand, are included in food blog posts most of the time by most food bloggers. Seventy-four percent of food bloggers use photos 80% of the time or more. Reviews of restaurants, cookbooks, and kitchen gear, on the other hand, end up on 11% of food bloggers posts very frequently (80% or more posts contain reviews) while fully half of food bloggers hardly ever post reviews (20% or fewer of their posts contain reviews).
Since most food bloggers like to mix things up at least a little – hardly anyone has such a firmly established template for their blog content that 100% of their posts contain recipes and photos while 0% of their posts contain videos or discussion of non-food content (which would include mentions of important life events like getting a book contract, having a child, getting married, or getting cancer). With content, then, I wanted to let food bloggers explain about how often they posted a variety of different kinds of content. But then I had this difficulty of having proportions in the rows and the columns of the graphic which makes it difficult to interpret. Believe me, the tabluar data without the blocks changing sizes and colors was even harder to interpret so turning this information into a visual did help the analysis along by making the patterns clearer.
What surprised me
I was expecting many more bloggers to report including recipes more often. Only 37% said that 80% or more of their posts contained recipes. From what I gathered in the interviews, having someone else make your recipe and then leave a comment about it is one of the routine gratifications associated with food blogging. Web traffic to the site from google.com and on mini-search engines within the site is generally related to recipes, as well. So whether food bloggers care about the deeper meaning associated with food blogging and being part of a community or the hard-nosed economics and web traffic side of writing a blog, from the interviews, I was expecting recipes to be a bigger part of reported content than what I found in the survey. Recipes are one of the main activities around which both creativity and community are wound. They also draw a lot of traffic. On blogs, traffic often equals money (though not all that much money, which is why I think the meaning associated with recipes is more interesting than the money associated with recipes).
I was not at all surprised that most bloggers ignore nutritional information but I think that people who have never done much with food blogs would be surprised to see that three-quarters of bloggers mention nutrition and nutritional information 20% of the time or less. Food blogging gets its meaning and importance through practices of creating and community-making, not because the blogs are used as archives or tracking devices for those trying to lose weight or achieve other health goals. There are blogging communities organized around those things, but generally speaking, folks in those communities do not identify with the term ‘food blogger’.
Reference
Norén, Laura. (2012) Infographic: The Content of Food Blogs. The Food Blog Study. [www.foodblogstudy.info/findings.html]

Comments 1
Don Willis — August 8, 2012
Very interesting! Cool graphic!