What Works
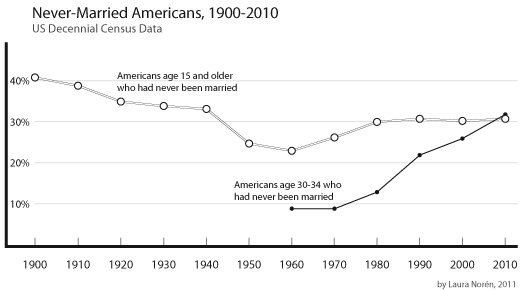
There are two great things about this:
- We see that the current rise in never married Americans still doesn’t match the numbers of unmarried Americans back at the turn of the century.
- We see that what is changing now isn’t so much the overall number of never married Americans (which has been hovering at around 30% for the past three decades) but the number of relatively older Americans who have never been married. I couldn’t find consistent numbers for people any older than the 30-34 year old category, nor could I find numbers for the 30-34 year olds available online from before 1960. I am still working on extending that portion of the graphic back to 1900.
What needs work
I need more numbers! I can’t understand the overall trend – which is the increase in never married Americans – without getting more historical context. I need that 30-34 year old category to extend all the way back. I also need to know what the deal is with slightly older cohorts, like 40-44 year olds. If all this graph tells us is that people are getting married later that is a very different story than the one that sounds like: “Americans aren’t getting married at all”. Marrying late and never marrying are two different scenarios. I cannot yet tell from the numbers I’ve got, just what is going on. And the problem with the aggregate data is that it is not granular enough to help understand current trends. Pooling 30 year olds with their parents and grandparents does not help me understand the 30 year olds (or the 20 year olds). And I really want to know what is going to happen in the near future, not what happened in the relatively distant past.
Other people have complained that the ’15 and older’ marital status category is crazy. Who gets married at 15?? But the problem is that we have to keep looking at that category or we cannot follow trends over time. That was the way the category was established back in the beginning, so in order to look across time, we have to keep the boundaries of the category the same. Now, to get around that problem, I included the 30-34 year olds, but that data slice doesn’t go all the way back.
Tricky census data.
And it’s black and white for easy printing. Otherwise I would have gone color.

Comments 4
Philip Cohen — March 31, 2011
Nice.
I think, though, that 30-34 is a funny age to use for tracking "never" marrieds. Average age at marriage is approaching 30.
I've done a variety of graphics on these trends. Lots of room for interpretation...
http://familyinequality.wordpress.com/2010/10/28/choice-interpretation-on-marriage-trends/
http://familyinequality.wordpress.com/2010/11/11/married-more-and-less/
http://familyinequality.wordpress.com/2010/11/09/past-predictions-marriage-dreams-not-quite-true/
Philip Cohen — April 1, 2011
Thanks. Well, if 87% of Whites and 64% of Blacks today are married by age 45, probably not more than a few percent more will marry. So, for Whites it'll probably approach 90%. Not quite universal, but quite common. As for today's young(er) people, there's really no way to tell the difference between marriage delayed and marriage foregone. Yes, almost everyone says they'll get married, but then again no one predicts they'll get divorced, so what do they know?
Brian Wofford — April 15, 2011
I could legitimately go on-and-on concerning the multitude of adverse, underlying reasons our inadequate American society clings to the last afflicted legalized form of human proprietorship.
Instead, I'll express that as a single white male of 53 whose had several opportunities with those beloved, I've never once seriously considered it, nor will. To me, it's always been an ill, antiquated, programmed tradition that does its utmost to blatantly give 'true' love and care despicable names.
It's the 21st century and we sorely need a new plan. I'm convinced that if it were ever abolished we'd eventually have an inherently much happier, sensibly liberated civilization (and Independence Day's but another correlational, vulgar lie that makes me sick).
America, the pitiful.