What works
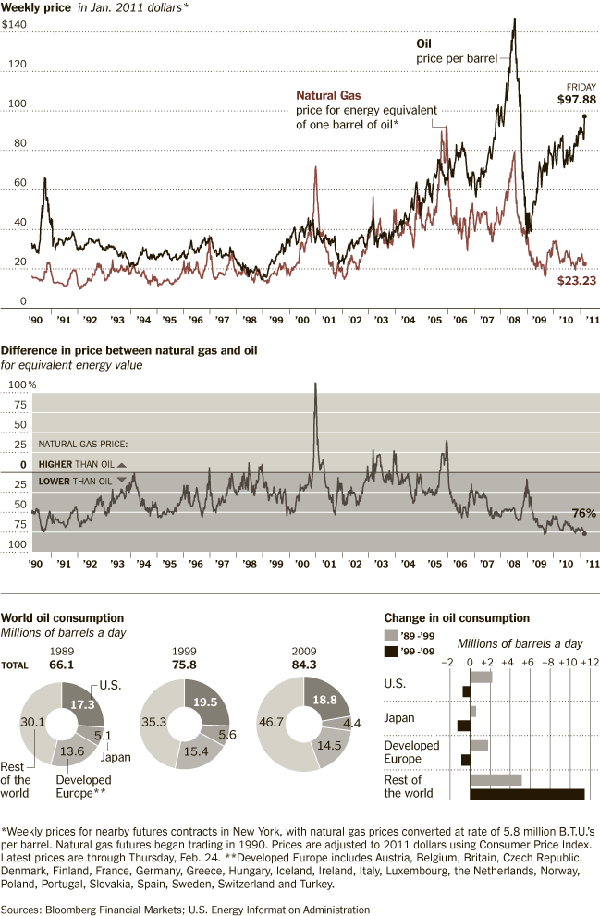
If one graphic cannot tell the whole story, use three. Or four. Or four static graphics plus an interactive graphic (keep reading)! Most people would have stopped creating graphics after they produced the first graph – the one that tracks oil and natural gas prices from 1990 up to 2011. I appreciate the second graph which compresses the salient point from the first graph into a single line. It hammers home the point that what we are meant to notice is not the fluctuation in natural gas prices so much as the fluctuation in the difference between gas and oil prices. The other two graphics both deal with oil consumption only, something I find slightly odd given that the story is about natural gas. Yes, it is clear that there is a relationship between oil and natural gas consumption – we see that with the first two graphs. But we also see from the first two graphs that the relationship between oil and gas is not always predictable, especially not right now where natural gas is significantly cheaper than oil, cheaper than we would have predicted if we had to use the past as a guide. Yes, of course oil prices might go up as they respond to increasing demand from “the rest of the world” (weird terminology that means NOT US, Japan, or “developed Europe”).
It’s also true that oil prices are sensitive to political unrest in the middle east, which has been underway lately in a number of countries. It is difficult to tell if these graphs are using numbers crunched before the revolution in Egypt and unrest in Middle Eastern countries or after. The graphic was published 25 February 2011, well after the Egyptian revolution began. But the weekly price is listed in January 2011 dollars which means the rest of the information might have preceded the Egyptian revolution. Still, the path towards divergence appears to have begun in 2009, which renders the timing question I raised a bit beside the point. And this is why we look at trends over long periods of time. Point estimates can be misleading.
More is more

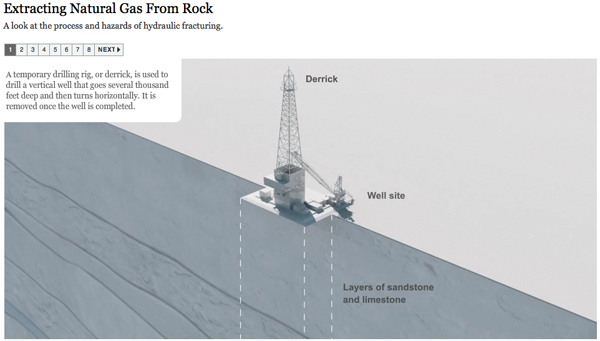
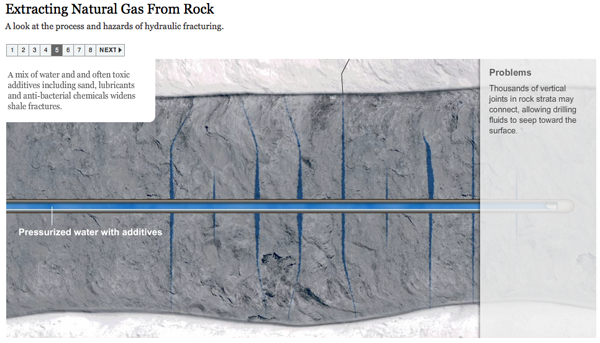
The Times has been covering natural gas regularly, and it seems they decided that more is more in pursuit of a fully comprehensive understanding of natural gas not just as a brute commodity being traded in a free market, but as a potentially harmful environmental toxin, especially when it is seen as being at the center of brutal extraction practices. There is an elegant slideshow-animation that describes how natural gas is extracted and explains what the consequences of this practice can be as a result of the mechanical changes the drilling process leaves behind.
The combination of slideshow and animation works well here. If it were just an animation, it would be hard to fit the explanatory text within the temporal flow. Giving the viewer a chance to watch a small segment of animation and then read an explanation about what is supposed to happen and what can go wrong brings appropriate pacing to the explanatory experience. What’s more, I think it is a great idea to force the viewer to keep clicking in order to advance the slides. It’s barely above a fully passive learning experience, but anything that raises the level of participation – like reading or having to click somewhere – helps keep the viewer’s body and mind more fully engaged and pumps up retention.
My favorite slide came near the end – these people built up some narrative tension. I kept wondering where this drilling process went wrong. So when do the toxins hit my drinking water? That’s what I was wondering, and this slide filled me in. It’s a simple question, one that we know we’ll find the answer to based on the title of the slideshow, but it’s always good if your viewer goes in with some direction. An obvious question is fine. Getting viewers to envision a more complicated question might be better, but overall I think this approach works well.

Please click through to make sure you understand why fracking presents environmental problems. I do not want to spell it out here because I think that would lessen your experience of the interactive graphic as a learning tool.
References
Norris, Floyd. 25 February 2011 Two Directions for the price of natural gas and oil New York Times.
Graham Roberts, Mika GrÖndahl and Bill Marsh. 26 February 2011 Extracting Natural Gas from Rock [Interactive Graphic]. The New York Times.
PS
It feels like swearing to talk about fracking. Thank you, Battlestar Galactica.
