What works

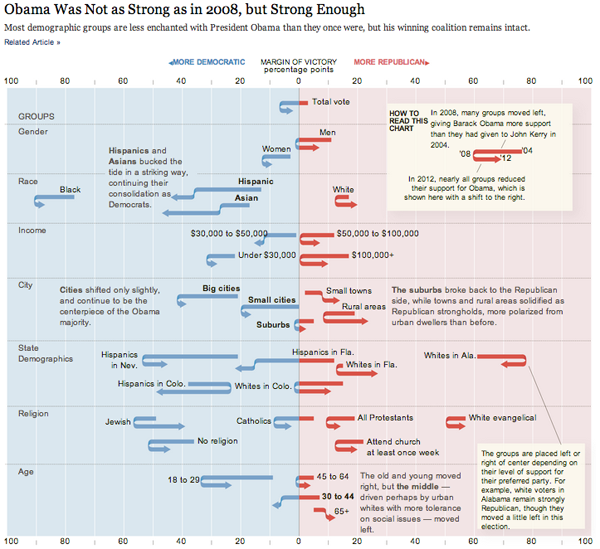
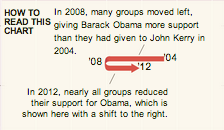
This graphic shows us data over time and is thus a kind of timeline but it uses a graphical device that I have never seen before – the U-turn arrow – to indicate changes in people’s political attitudes at three points in time. This works brilliantly for the dataset and is a strong argument for the use of design and designers in information visualization. A standard timeline would not have worked well with a dataset that has only three points in time that need to be represented for a plethora of categories (the categories are voting blocs in this case). The U-turn arrows allow us to see just how far various voting blocs moved from their 2004 position in 2008 and then again how far they moved in 2012. If the voters in these blocs became more liberal in 2008 and then slid back towards a more conservative position, the arrow makes a U-turn and it’s very easy to visually compare the length of the arms of each side of the U. If the particular voting bloc got more liberal in 2008 and continued towards an even more liberal position in 2012, the arrow does not make a U shape but it still has a kink in it at 2008 so that we can visually compare the length of the 2004-2008 section to the 2008-2012 section. The use of this type of U-turn/kinked arrow is new to me and it’s just brilliant. It’s one of those things that is so easy to understand immediately that we forget we’ve never seen it before. That’s the mark of smart design.
The other thing that this style of timeline does so well is that it allows variation on the starting points of the different voting blocs along the horizontal axis. We get to see that some groups are so far over in the liberal or conservative camps they may never be ‘in play’ and other blocs have voting patterns that push them over the critical boundary in the center of the graphic.
If this type of data were represented on a line graph, the variation in liberal vs. conservative might have been plotted on the vertical axis (though, hopefully this graphic makes it clear that chart conventions can be kicked to the curb at any point in time). Visually, I like the liberal/conservative spectrum better horizontally because it plays with the left-right semantics that are already used to discuss political beliefs.
What needs work
We need more designers working in visualization departments so that we end up with graphics like this that are tailored exactly to the structure of the data and the story it tells rather than trying to select from an existing conventional data representation type.
Kudos to Amanda Cox, Ford Fessenden, and Alicia Desantis at the New York Times.
References
Cox, Amanda; Fessenden, Ford; and Desantis, Alicia. (2012) Obama Was Not as Strong as in 2008, but Strong Enough. [information graphic] New York Times.
