Viewing note
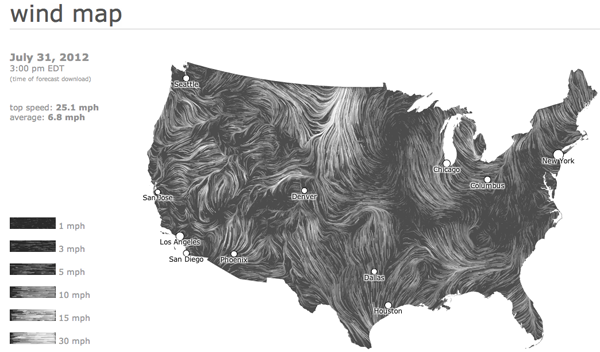
Click on the image above or here to go to the actual graphic. What you see above is just a screen grab. If you like the screen grab, you will love the active graphic in which you can see what it would look like the visualize the wind blowing across the US right now. Yes, whenever you are reading this, you can download recent data to populate the graphic.
What works
This is a great use of a map to display information. Think, for instance, what the same data would look like in a table.
State Speed Direction
Bismarck, SD 16 mph S
Columbus, OH 5 mph W
Fargo, ND 8 mph N
Minneapolis, MN 2 mph SW
New York, NY 6 mph E
In a table, cities would probably be arranged alphabetically which is fine if you want to know exactly what is happening in a given city but terrible if you are trying to discern if there’s any geographical pattern to wind flows. Looking at the map, it is easy to detect geographical patterns. In fact, it would be nearly impossible to avoid detecting geographical patterns. Huge win for the map as a graphic with respect to wind data.
The fact that the wind appears to blow is a programming achievement.
The fact that users can update the graphic with a fresh pull-down from the National Digital Forecast Database is another major programming achievement.
The creators of the graphic at hint.fm offer this disclaimer, “We’ve done our best to make this as accurate as possible, but can’t make any guarantees about the correctness of the data or our software. Please do not use the map or its data to fly a plane, sail a boat, or fight wildfires”. That being said, I think the graphic could be useful for those sorts of purposes. I also think it could be used to perform site selection for windfarms or at least as an educational tool to explain to people why the Dakotas make excellent states to harvest wind while the neighboring state Minnesota is a poor choice.
What needs work
I wish there were an easier way to find graphics like this. I stumbled upon this one via Albert Cairo’s twitter feed, but there must be other awesome graphic work out there just waiting to be discovered.
Reading suggestions
On that note, if you happen to enjoy stumbling upon information graphics, I highly recommend visiting visualizing.org and visual.ly, two websites that aggregate information graphics by allowing people to upload their own work. Both sites have relatively high collective standards for design and are trying to maintain the same high standards for data quality.
Then there’s Nathan Yau’s blog, flowingdata.com, which has long been on my list of must-reads. I assume many of my readers know about flowingdata but it is worth mentioning because it’s a great blog.
Good.is has a portion of their site set aside for GOOD information graphics.
For a more strictly aesthetic experience, behance.net is a giant collection of graphic artists’ portfolios. Looking through it is the digital equivalent of walking around in a flea market – great stuff, unique stuff, and lots that is instantly forgotten even though its presence adds to the atmosphere. Most graphic artists are not information graphic designers so much of what is on behance is not information oriented.
I sometimes find things on pinterest, too, which is more like the digital equivalent of a mash-up between jcrew and a flea market. Oddities organized. It’s much harder to find good information graphics there because, for reasons I do not understand, pinterest is dominated by the long vertical graphics that require lots of scrolling. I’m not a huge fan of those. They encourage laziness – nothing needs to be integrated when you have an infinite length of scroll to just layer unaffiliated fact upon unaffiliated fact and hope that with a picture or two thrown in, a narrative will emerge.
Besides newspapers and magazines, where else do you find information graphics?
References
hint.fm (2012) Wind Map Graphic.
visual.ly
visualizing.org
flowingdata.com
behance.net
pinterest.com


Comments 1
Joanna — August 1, 2012
First, I should say that I really appreciate your blog! I'm not a graphic designer by any stretch of the imagination, but I'm a graduate student and I love data and snythesizing information. Your analysis of various infographics has helped me understand what to prioritize, and how to most effectively use design to communicate certain patterns and relationships.
I came across that wind map in a GIS course last semester; it's fascinating to see the patterns, and, as you said, the whole thing is quite the programming achievement.
As far as sources for infographics (in addition to your blog!) I check out http://www.informationisbeautiful.net/. A few good ones to get you started: The Hierarchy Of Digital Distractions (Sept 2009), Vitamin D (Nov 2010), Sunscreen (July 2011), and Nutrient Claims ("Snake Oil," May 2011). Some of the graphics tend towards the long, scrolling-required style of pinterest, but that's mostly when the image is a combination of graphics about a common topic.
Randall Munroe's webcomic, xkcd.com, is another good source. Every so often he posts infographics instead of his regular comic strips. They always pull together a mind-boggling amount of information! The graphics might not always be the easiest to read (they're usually quite dense), but the perspective he offers via placement, design, formatting, etc. and the work he does to gather, process, and interpret the data is always valuable. Some examples:
"Money" http://xkcd.com/980/
"Lakes and Oceans" http://xkcd.com/1040/
"Radiation Dosage Chart" http://blog.xkcd.com/2011/03/19/radiation-chart/
"Movie Narrative Charts" http://xkcd.com/657/
"Exoplanets" http://xkcd.com/657/
Enjoy!