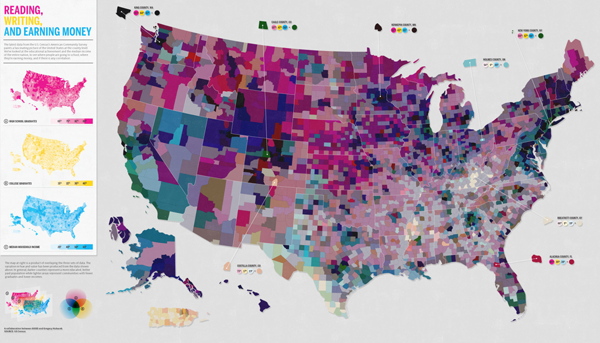
What works
Nothing is working for me with this graphic except possibly the few places where the designers offered detailed information about a particular location’s high school graduation ranking, college graduation ranking, and income ranking. But that’s being generous.
What needs work
Horrible use of a map. Maps should only be used where there is good reason to believe the information being conveyed is tied closely to geography. This information is not tied closely to geography though it might be tied closely to states. But states need not always be represented as geographical entities. Often, they are political entities and their particular geography is not salient.
The math that led to the graphic flattens important details and renders this a useless graphic. What I believe the designers did was something like this:
- They took all of their numbers and turned them into some scale between 0 and 100%
- Then they decided to represent each of the three variables with pure Cyan, Magenta, or Yellow. The higher the state scored on the scale from 0-100, the more saturated the color value.
- Then they gave each county a combined score by building new colors from mixing the values of the previous three. Higher scoring states ended up with more saturated colors. Basically, higher scoring states started to approach black. States that scored high on just one vector ended up having a clearer, lighter color profile.
Here’s the big problem with this. It was hard for me to explain to my MIT-educated friend so I’m not sure this is going to make sense the first time ’round. Representing everything on a scale from 0-100 is a slide towards obfuscation. The graduation rates are both unadulterated rates. The income data represents un-scaled median incomes. I appreciate that they are not scaled, but I have a hard time adding 65% with $45,000. That’s some troubled math. At least in the monochrome maps we know what we’re looking at before the three variables get added up.
A grave sin was committed when the numbers for these three different variables were added up. Now, of course, it wasn’t the numbers that were added up. It was the color values of each of the three separate data points that were added up. Additive color seems to be something that does not send up a red flag. I can guarantee you that if they had presented something – a table or graph – where they had ended up adding values from high school graduation, college graduation, and income, red flags would have been flying. Why? Well, maybe you’re starting to catch my drift, but I’ll help you by spelling it out. What happens when the colors are added is a clear violation of the ‘apples to apples’ rule. Comparisons do not work unless you are sure you are comparing like things. Graduation rates are not like income. They are two different kinds of numbers – one is a rate the other is either a linear value or a log-linear value. Either way, they cannot be added up and still make sense. It’s no surprise that the graphic ends up looking like an incomprehensible slurry of a gray area.
References
GOOD and Gregory Hubacek. (March 2011) Reading, Writing, and Earning Money in GOOD Transparency Blog.

Comments 1
Jon — April 9, 2011
While I totally agree about unnecessary use of maps (and find these additive color maps particularly hard to interpret), I imagine that they probably scaled the color based on deviation from the median value of the indicator in question. At least, that's what I would do if I were making the map. That way, it would show areas where, for instance, graduation rates were higher than average but income was lower than average in a different color from places where both graduation and income were below average. Still probably not nearly as effective at conveying information as a simple bar chart though.