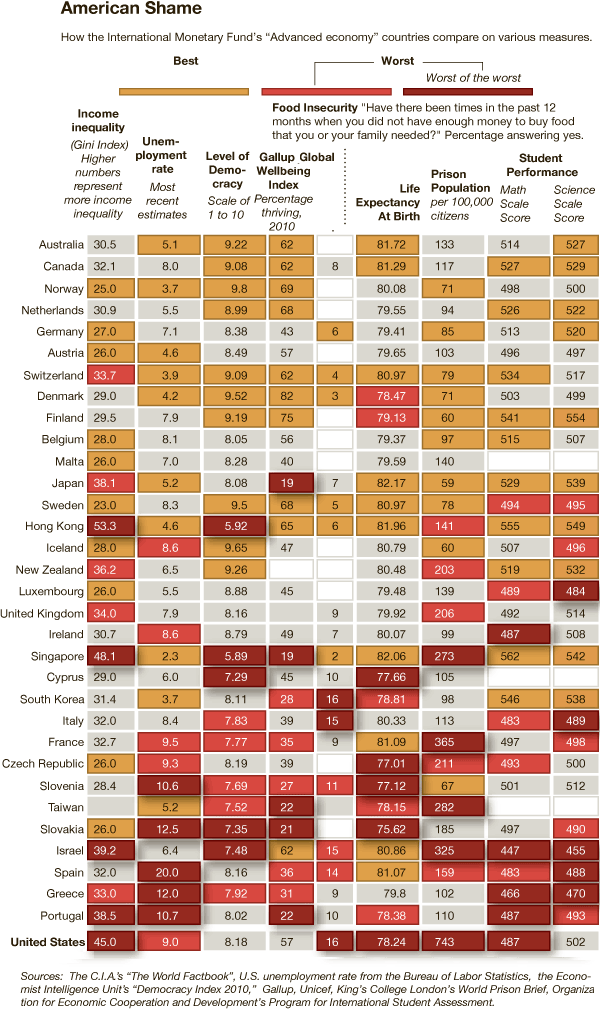
What works
To social scientists: you can make your own information graphics with the programs you are already comfortable using. This graphic is something you could put together in Excel. One of the common questions I hear goes something like this: “I want to use more infographics but HOW do I make them?” I often use the Adobe Suite to make my graphics, but sometimes Excel can be a decent tool for making fairly sophisticated tables. I would not recommend trying to use Word to make graphics. You will become so frustrated with the clunkiness of trying to use a word processor as a graphic design tool that you may be tempted to pick up your computer and throw it out the window. Or, if you are a pacifist, to pick up yourself and leave the office for the rest of the day. But Excel is a more robust, stable program that won’t get finicky if you start manipulating cell colors and border conditions.
What needs work
In general, Excel is probably not the program that’s going to generate elegance. It will allow you to use color and line weight to add layers of visual information, but as you can see here, the results are not necessarily going to be attractive.
In particular, this graphic makes weird color assumptions. The red is bad, the gold is good, and though there is a kind of natural spectrum between red and gold, this graphic doesn’t follow it. I would have used a single color and varied the hue. I have no idea why the middle category is grey. In my mind, grey does not appear on the color spectrum between red and gold. To strengthen this table-as-graphic, I’d go ahead and let every cell (except the empty ones) sit on the color spectrum being used to represent the best and worst. Color can be most meaningful only when it is used consistently. As it stands, there is an inconsistency in the middle categories here with the grey and an unnecessary use of two colors where one would have been enough.
I’m on the fence about the use of apparent depth or 3D-ness. The ‘worst’ buttons stick out like red pimples. On the one hand, the wannabe rebel in me is pleased to see that sort of flagrant display. On the other hand, the depth doesn’t so much add information as it adds visual clutter. Red is enough to make the ‘worst’ seem bad, right? I don’t know. Like I said, I’m on the fence. Maybe the depth element adds value because it helps anchor the eye *somewhere* in this rather extensive table. But it’s used so much that I’m not sure that purchase rings up when all is said and done.
Overall, presenting tables-as-graphics introduces an information overload scenario, one that this particular approach did not surmount. But that doesn’t mean all tables are bad or all uses of color in tables is bad.
I am also deeply skeptical about the Gallup Global Well-Being Index. I’d skip it. Who the heck knows what it means to have a failure to thrive? Very skeptical…
References
Blow, Charles. (2011) “Empire at the End of Decadence” in The New York Times, 19 February 2011. Featuring information graphic “American Shame”.

Comments 2
dianess — February 24, 2011
More on what needs work. I can't figure out the cut-points for why certain cells are colored as they are. Take life expectancy. The US is dark red (worst of the worse) at 78.24, Taiwan is light red at 78.15 years. Italy and Israel appear to tie at 15% with food insecurity, but they're colored differently. On the math score scale (where lower scores are worse), why do the US, Portugal and Ireland get colored dark red with 487, but Spain and Italy with lower scores of 483 are colored light red?
Unless I missed something, the colors are misleading because they appear to be applied inconsistently.
Laura Norén — February 28, 2011
The New York Times did post a correction related to the inconsistency in colors that you have detected. Good looking out.