España Gastos Estados

What works
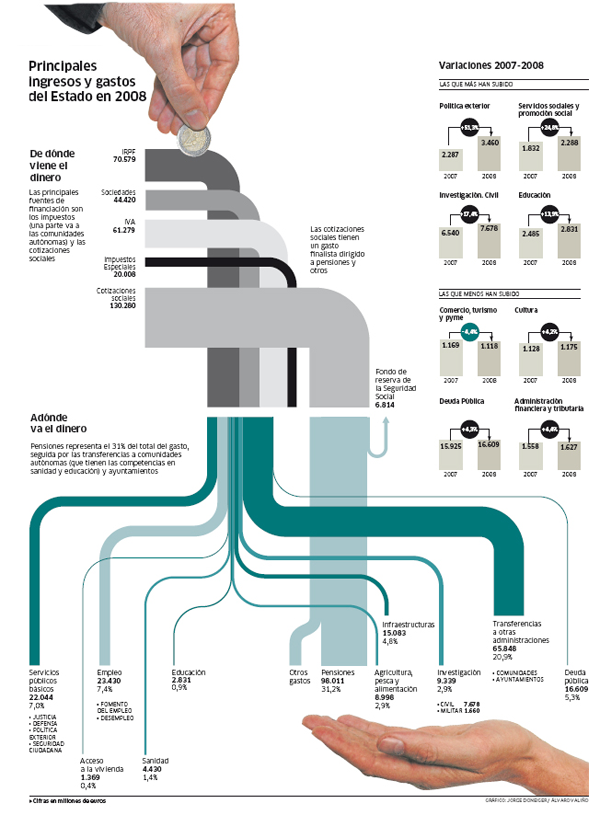
The point of the graphic is to show how funds flow – money in, money out. Now, we have seen this kind of thing before, but here I just want to point out that in cases where the flow of a quantity is the point of the graphic, there are some benefits to abandoning the graph format. Just try to imagine this as a bar graph. It’s easy enough. Instead of flows orienting themselves at right angles and looping arrows, they just straighten, assume the same width, and grow to varying heights. Flows in could be black, flows out could be grey (and overflows could be red!). What would be lost in a bar graph would be the sense of flow. If done cleverly, what would be gained in a bar graph would be the ease of comparing the size of in-flow to the size of out-flow.
Another benefit of this graphic is that it becomes obvious that information graphics can cross international boundaries with greater ease than, say, the same information written out in a report. My Spanish is improving, but I still could not make it through a report on the budget. I can, however, stumble through this information graphic.
What needs work
Here, it is difficult to sense, without doing mental math using the numbers provided, how in-flows compare to out-flows. I’m also a little confused about why some flows fall into the hand, and others terminate outside the hand. I would think education, sanitation, basic public services, housing services, and employment services would be the kinds of things flowing into the public hand. Research and transfers to other administrations, not so much. Pensions, yes, they should go to the hand and they do.
What do you think of the hands? As an aesthetic device, I’m not sure I like them at all. As a device to segregate categories of spending into those that are more directly aiding the public and those that are swirling around in a more internal fashion – research dollars going to schools, institutes, and the military which are primarily funded by the government are pseudo internal – I could support that. I just don’t think it was done correctly here.
References
publico.es (2008) “Espana Gastos Estados” [graphic by Jorge Doneger and Alvaro Valiño]

Comments 1
What is Sociology Dissertation? — July 29, 2010
[...] Espaa Gastos Estado Graphic Sociology [...]