What Works
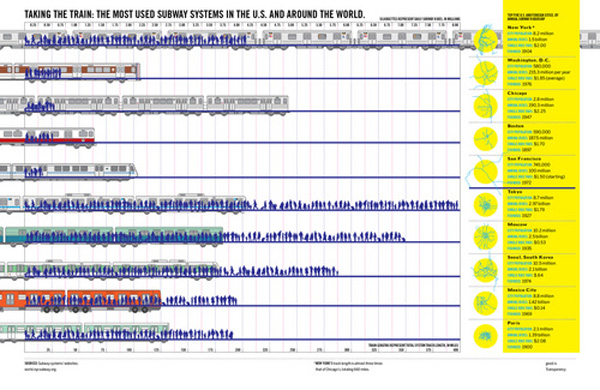
Good magazine is indeed a good source for thought provoking information graphics. This one has to be clicked through to be seen in any kind of entirety. What I like is the layering – they manage to represent total track length, total yearly ridership (both visually and with absolute numerical data), as well as showing little schematic maps of the systems themselves. You see that many of these systems are hub and spoke systems.
As urban areas continue to grow, transit options are going to need to expand and grow in places that don’t have mass transit infrastructure dating back to the turn of the 20th century like New York and Boston. An article in this month’s context magazine by Michael Goldman and Wesley Longhofer writes about the difficulty of adding mass transit of any sort to the existing urban fabric looking at the Indian city Bangalore: “hundreds of residents marched to protest the widening of streets and felling of trees for the new elevated Metro system. Bicyclists claimed that tearing down more than 90.000 beautiful shade-producing trees ruined the appeal of what was once known as India’s “garden city.” Shop owners and concerned citizens pushed for the Metro to be built underground so businesses wouldn’t be shuttered to make way for it. Advocated for the poor argued that widening roads would turn sidewalks, where so much daily commerce and social interaction occurs, into prime real estate. Purge the city of its street vendors and sidewalks, and you’ve stripped the life out of the Indian city.” That gives a whole new context to systems with hundreds of miles of track.
What Needs Work
I wish that there would be a way to show that the installation of mass transit systems bulldozes old neighborhoods and creates new opportunities. New growth tends to look very different that the old growth it replaces. I think there’s a call for a new kind of mass transit graphic that can show the past and present of transit decisions both in economic and social/cultural terms.
Relevant Resources
Good Magazine Transparency Graphic with Robert A. Di Ieso, Jr.
Goldman, M. and Longhofer, W. (2009) making world cities Contexts, pp. 32-36.

Comments 1
chuk — April 1, 2009
I would like to know what proportion of each cities population actually uses their transit. I'd be curious to know how these different cities compare.