What Works
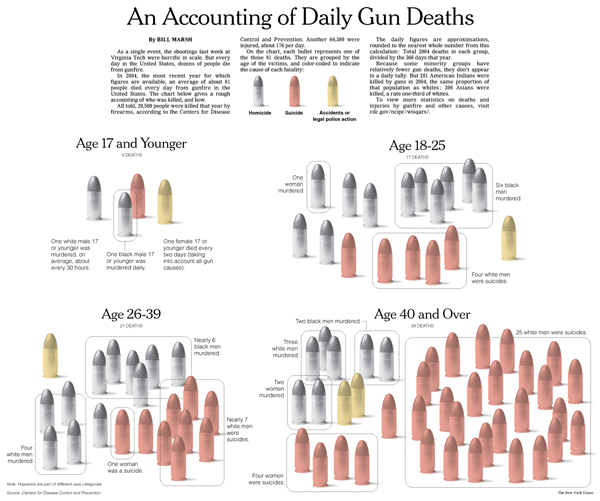
This is an odd kind of chart, it uses 2004 data to show how the average of 81 people who die each day by guns are killed – suicides, homicides, accidents/police action. Note that people who die in war are not included. I find this both intriguing and incomplete. For contextualizing sensational events like yesterday’s murders and suicide in Alabama, this is useful. People die everyday at the wrong end of guns, some as a result of homicide, more as a result of suicide in older cohorts. But…
What Needs Work
… where’s the depth? The dotted circles grouping the bullets are not all that sensitive. It’s the same dots across the board, no matter what’s being grouped. Somehow that seems too hasty; it takes a lot of reading to decode this graphic. There could have been a way to do it so that race and gender were visually obvious without needing the words. Maybe the bullets representing dead females could have taken on a feminine form. Maybe race could have been represented by colored bands around the bullets.
Relevant Resources
Arum, Richard and Taylor, Edward. (2007, 7 May) The Sociology of School Shootings Edited transcript and audio link of a recent Voice of America interview with Richard Arum of the SSRC and Edward Taylor of U. Minn., presented with the permission of VOA. From the SSRC site.
Dewan, Shaila. (2009, March 10) Gunman Kills at Least 10 in Alabama, Then Takes His Own Life After a Chase in The New York Times US Section.
Marsh, Bill. (2007, 21 April) An Accounting of Daily Gun Deaths in the New York Times.


Comments 8
Meditating On » Graphic Sociology » Gun Deaths - Measured Daily — March 13, 2009
[...] Hitchcock posted a noteworthy aricle today onHere’s a small snippetArum, Richard and bTaylor/b, bEdward/b. (2007, 7 May) The Sociology of School Shootings Edited transcript and audio link of a recent Voice of America interview with Richard Arum of the SSRC and bEdward Taylor/b of U. Minn., presented with the b…/b [...]
david Wilson — June 9, 2009
How many people die in the United States every day that are alcohol related?
marty — August 23, 2009
During 1999--2005, a total of 311,356 motor vehicle--related deaths occurred in the United States. The overall average annual age-adjusted rate for this period was 15.4 deaths per 100,000 population (range: 15.2--15.7 per 100,000 population); the annual death rate decreased by 1% from 15.3 in 1999 to 15.2 in 2005
Taken from U.S. Government Stats. Not the New york Times
Twitter Trackbacks for Graphic Sociology » Gun Deaths – Measured Daily [thesocietypages.org] on Topsy.com — August 31, 2009
[...] Graphic Sociology » Gun Deaths – Measured Daily thesocietypages.org/graphicsociology/2009/03/11/gun-deaths-measured-daily – view page – cached What Works This is an odd kind of chart, it uses 2004 data to show how the average of 81 people who die each day by guns are killed – suicides, homicides, accidents/police action. Note that people who die in war are not included. I find this both intriguing and incomplete. For contextualizing [...] — From the page [...]
David — June 28, 2010
Good job Marty!
tttttttttttttttt — December 1, 2010
david, the issue isn't about alcohol. quit changing subjects to justify your perversion for guns!!!