What Works
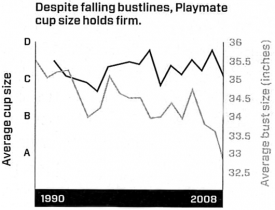
This graph does a nice job of representing three different linear scales without having to be in three dimensions. Time is on the x-axis, as it usually is. Then we see cup size on the right y-axis and bust size on the left y-axis. These two measurements use quite different scales – bust size is measured in inches and cup size is measured in two different ways, both of which are mapped onto an equidistant lettered scale. The distance between an A and a B on the left y-axis is actually about the same (1″) as the distance between 33 and 34 on the right y-axis. If you were going to set up a similar graph, it would be important to maintain the ratio between the two y-axes measurement scales. In this case, the ratio is 1:1, but you could imagine that the same style graph would work if the ratio were 1:2 or 1:3, just about any linear relationship will do.
What Needs Work
I suppose it may be more risque, but it strikes me that the same information could be conveyed with more pizzazz if the relationship were communicated visually. Most people, women included, don’t have a good sense of just what changing both cup size and bust size at the same time is going to look at. Humans are good at perceiving symmetry and proportion. Thus, I’d rather see this information as a series of clay models than as a chart. Bottom line: the information is visual to begin with, we’re talking about the way playmates look, after all. So why translate visual data (the pictures of women) into a chart?
Relevant Resources
Katharine Gammon for Wired Magazine (2009) Issue 17.02 “Infoporn: Today’s Playmates Are More Like Anime Figures Than Real Humans”
Carol Rados for the Food and Drug Administration Consumer Magazine (2005) Making an Informed Decision About Breast Implants
